19.3 Comparison with the Australian Government
Comparison of VoTa to the Australian Government
Australia 2025-2026 budget
| Major category | Spending (AUD billion) | Percentage of government spending |
|---|---|---|
| Social security and welfare | $290.9 | 37.0% |
| Health | $124.8 | 15.9% |
| General purpose inter-governmental transactions | $99.9 | 12.7% |
| Other | $149.7 | 19.1% |
| Defence | $51.4 | 6.6% |
| Education | $54.0 | 6.9% |
| General public services | $31.4 | 4.0% |
| Interest | $23.9 | 3.0% |
| Transport and communication | $16.5 | 2.1% |
| Fuel and energy | $19.2 | 2.4% |
Consider that we interpret the categories in terms of redistribution to households versus services delivered through providers. This mirrors the VoTa constitutional split between UBI transfers and public service funding. The table divides Commonwealth spending into functional categories. These categories naturally fall into two broad groups:
- Redistribution to households (transfers): This is spending whose economic effect is to increase private disposable income. In the Australian budget, this is overwhelmingly: Social security and welfare: 37.0%. This includes pensions, JobSeeker, DSP, FTB, CCS, NDIS payments to individuals, and other transfer programs. This category is the closest analogue to UBI redistribution in VoTa.
- Services delivered through providers: These are expenditures where the government purchases or funds services delivered by institutions, not households. These correspond to public service funding in VoTa. Major examples include health, education and defense. These categories represent the government purchasing intermediate inputs and labour to deliver public services.
If we take:
- Redistribution ≈ Social security and welfare = 37%
- Services ≈ everything else = 63%
then the ratio of service funding to redistribution is: \[ \frac{\text{services}}{\text{redistribution}} = \frac{63}{37} \approx 1.7. \]
This means that, in the current Australian system, service provision is about 1.7 times larger than direct redistribution when measured as shares of total Commonwealth expenditure.
In VoTa, the real purchasing‑power ratio is: \[ \frac{\text{purchasing power for services}}{\text{purchasing power of UBI}} = \frac{R_{\mathrm{svc}}}{R_{\mathrm{ubi}}(1 - R_{\mathrm{tot}})}. \]
The Australian budget does not use a consumption‑tax‑inclusive funding model, so the exact formula does not apply. But the qualitative structure is the same: Transfers to households lose purchasing power when spent (because of GST and other taxes), whereas service funding retains full purchasing power because it is spent directly on intermediate inputs. Thus, even in the Australian system, service funding is mechanically stronger per dollar than redistribution.
Australia’s 37% vs. 63% split suggests that the political equilibrium strongly favours large-scale service provision, and moderate-scale redistribution. VoTa makes this ratio explicit and mechanically determined by \(R_{\mathrm{svc}}\) and \(R_{\mathrm{ubi}}\). The Australian budget shows that, empirically, modern welfare states already operate with a service‑heavy bias.
The tax allocation to UBI and services under VoTa
The following table shows some statistics which are reasonable in mid 2025:
| Category | Value |
|---|---|
| Mean full‑time gross income | $108,000 per year |
| Superannuation (12% of OTE) | $12,960 per year |
| Total employment package value | $120,960 per year |
| Median full‑time gross income | $90,000 per year |
| Median part/full‑time gross income | $72,000 per year |
| JobSeeker (single, no dependents) | $21,000 per year |
| Age Pension (single) | $30,000 per year |
| Net income on $108k (after tax + 10% GST) | $72,000 per year |
We take the total employment package of $120,960 per year to be an indicator of the mean pre-tax and pre-transfer income. Therefore, \( \overline{Y} \) = $120,960 per year.
The tax allocation to UBI and services under VoTa is calculated as follows:
| Parameter | Value | Description |
|---|---|---|
| \( R_{\mathrm{ubi}} \) | 0.2 | Consumption tax rate for UBI |
| \( R_{\mathrm{svc}} \) | 0.3 | Consumption tax rate for services |
| \(\overline{Y}\) | $120,960 | Mean pre-tax and pre-transfer income |
| \( U \) | $30,240 | UBI per person
\( U = \overline{Y} \frac{R_{\mathrm{ubi}}}{1-R_{\mathrm{ubi}}} = 120960 \times \frac{0.2}{1-0.2} = 120960 \times 0.25 = 30240 \) |
| \( U^{\mathrm{disp}} \) | $15,120 | Disposable UBI per person
\( U^{\mathrm{disp}} = (1 - R_{\mathrm{tot}})\, U = 0.5 \times 30240 = 15120 \) |
| \( S \) | $45,360 | Average tax allocation to services per person
\( S = R_{\mathrm{svc}} (\overline{Y} + U) = 0.3 \times (120960 + 30240) = 45360 \) |
Comparing VoTa and the Australian Government
To compare the VoTa system with the Australian income‑tax and welfare system, we use a person’s lived consumption capacity as the common basis. Australian tax is built around income; VoTa is built around consumption. Neither system shares the other’s tax base, but both ultimately determine the same quantity: how much a person can actually use to live their life.
Two people with the same lived consumption capacity are in the same economic position, regardless of how the tax system got them there.
Comparison of EMTR
The following are plots of the Effective Marginal Tax Rate (EMTR) versus the pre-tax,pre-transfer income, for various households, allowing for a comparison between VoTa and the Australian Government:
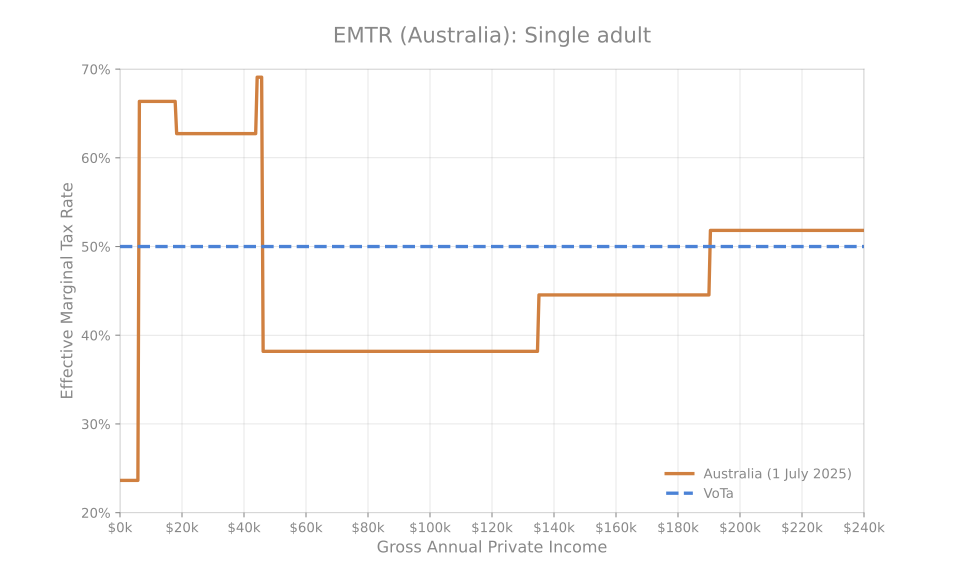
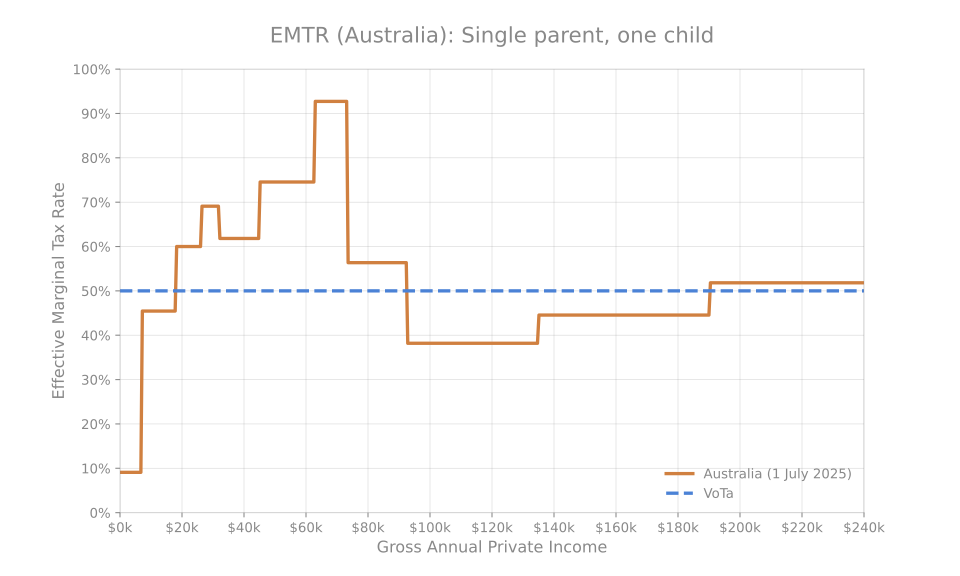
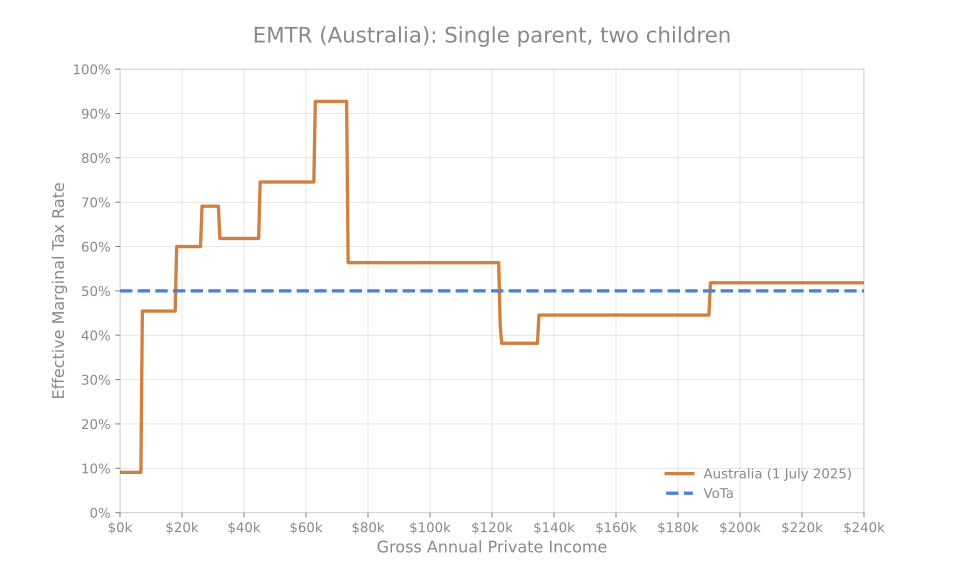
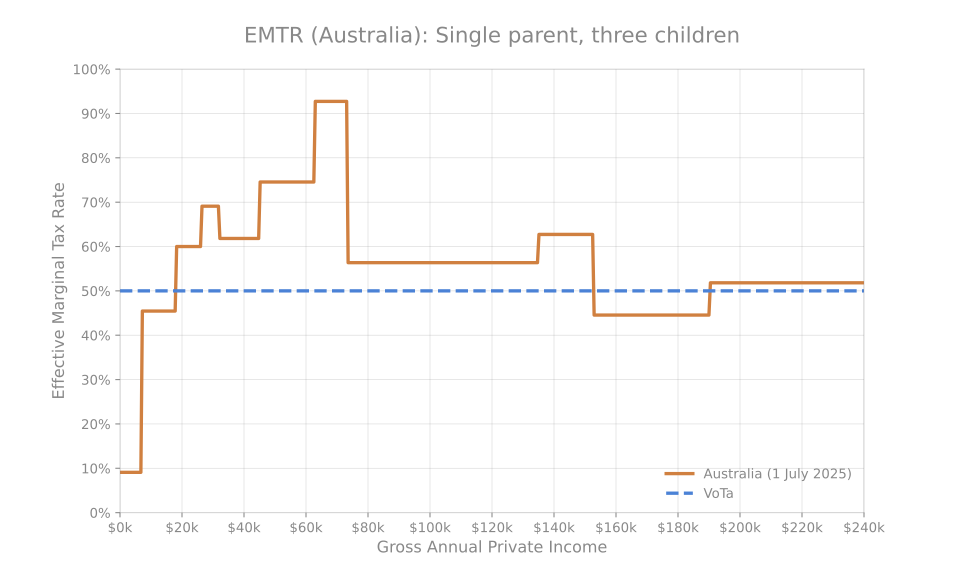
The Australian system is chaotic
The jumps, cliffs, and jagged shapes in the Australian Government curves are not meaningful features of the underlying economics at all. They are artefacts of a system built from dozens of unrelated rules, thresholds, tapers, offsets, and eligibility tests that were never designed to work together. Each kink or discontinuity reflects a bureaucratic boundary rather than any coherent principle, so the curves end up looking chaotic because the system itself is chaotic. These irregularities are not signals, they are flaws: arbitrary discontinuities that distort incentives, penalise certain households for no principled reason, and make the system impossible to understand or predict. The contrast with VoTa is stark precisely because VoTa’s curves reflect a single rule applied universally, whereas Australia’s curves reflect decades of accumulated exceptions.
The welfare trap
The "Mountain Range" you see in the Australian EMTR highlights the Welfare Trap. A high EMTR ruins incentives to work harder. There are specific income zones where earning an extra dollar is "punished" by the combined loss of welfare and increased income tax.
In the Australian system, the $63k to $73k range is where multiple "taper" curves collide. This isn't just a high tax rate; it is effectively state-enforced wage stagnation.
A single parent can hit the maximum friction point because of the following simultaneous deductions for every extra $1.00 earned:
- Income tax (Stage 3): 30c.
- Medicare Levy: 2c.
- Family Tax Benefit (FTB) Part A taper: 20c (the "income test" bites here).
- Child Care Subsidy (CCS) taper: 5–10c (as income rises, the percentage the government covers drops).
- Parenting Payment Single (PPS) taper: 0–40c (if they have not been fully cut off yet, this is the final "cliff").
- GST on the remaining cents: ~1c.
At the upper end of this range, the combined loss can reach 93c. The net gain is just 7c. If that parent works an 8-hour Saturday shift for an extra $300, they may walk away with only $21 in actual purchasing power after all benefits are recalculated.
EMTR for high‑income earners
The Effective Marginal Tax Rate (EMTR) for high‑income earners reflects two linked decisions: earning an extra dollar and then spending that dollar. Under the 2025–26 Australian financial year (1 July 2025 to 30 June 2026), the top marginal income‑tax rate is 45%, and the Medicare levy adds 2%, giving a 47% tax on each additional dollar earned. When the remaining 53% of that dollar is spent, it attracts 10% GST, which is effectively a tax on consumption rather than income. The GST burden on that remaining amount is , or 5.3% of the original dollar. Combining the income‑side and consumption‑side wedges gives an EMTR of 52.3%, meaning a high‑income earner keeps only 47.7 cents of each extra dollar earned once both earning and spending decisions are accounted for. This figure is accurate specifically for the 2025–26 tax schedule, which includes the 45% top bracket and a 2% Medicare levy.
EMTR (high income earners currently in Australia) = 45% + 2% + 10%(100% - 45% - 2%) = 52.3%
This is similar to the EMTR in VoTa, which equals \( R_{\mathrm{ubi}} + R_{\mathrm{svc}} \) = 20% + 30% = 50% for every person regardless of circumstances.
Comparison of disposable income
The following are plots of the disposable income versus the pre-tax,pre-transfer income.
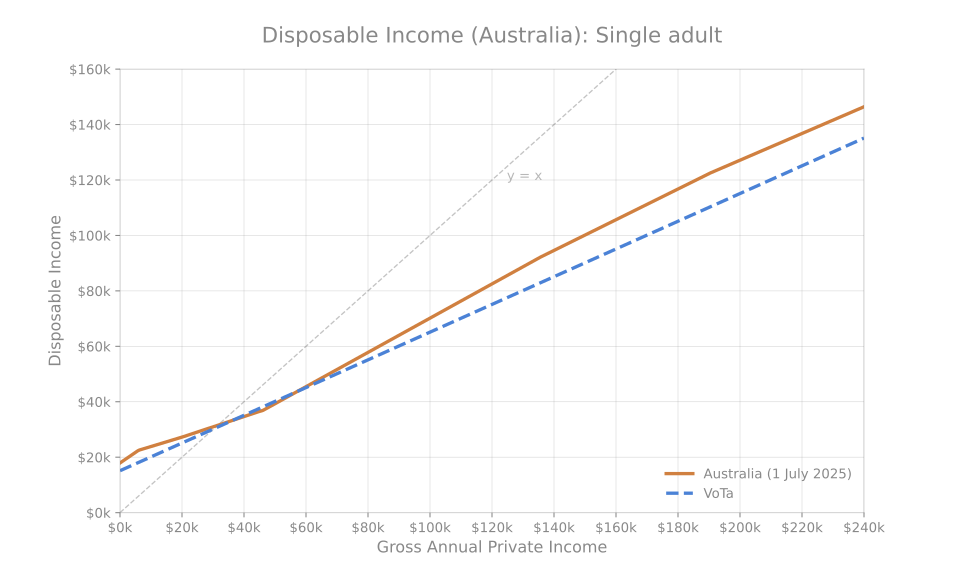
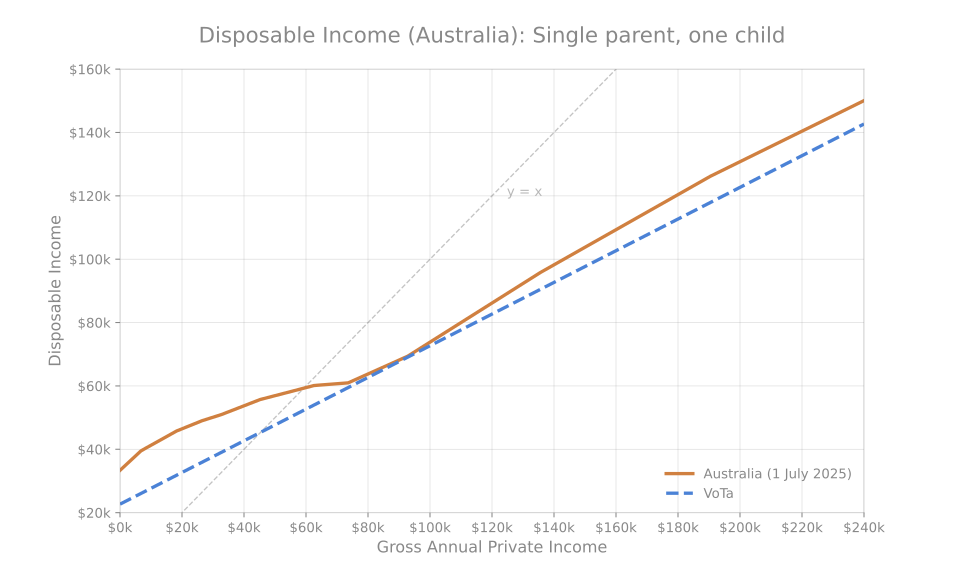
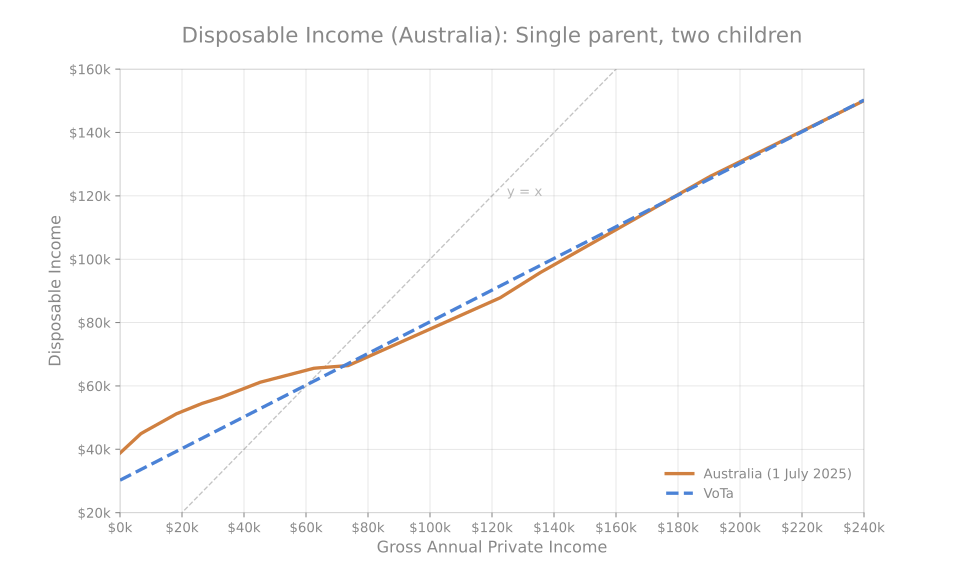
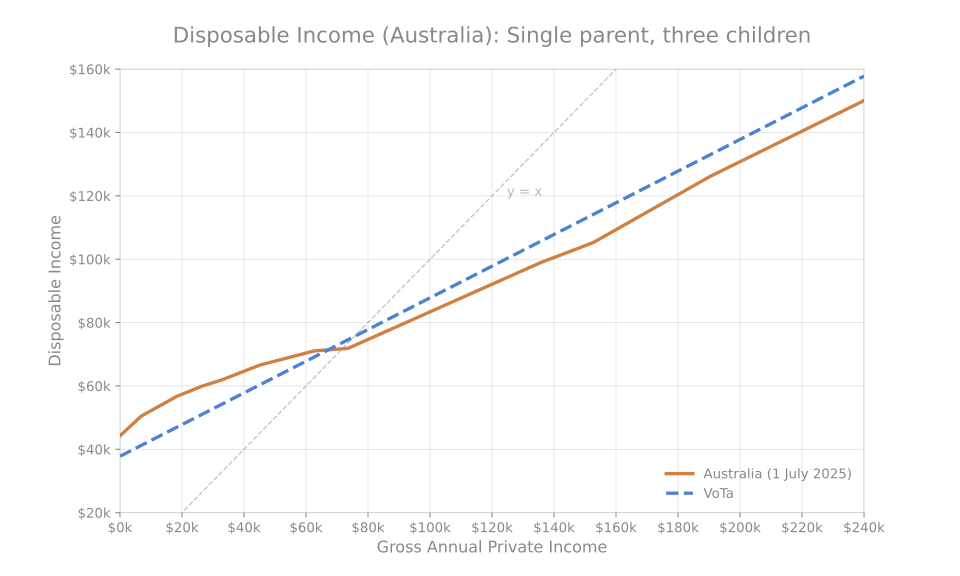
In VoTa the disposable consumption is an affine (straight‑line) function of gross income \(Y_i\):
\[ C_i^{\mathrm{disp}} = U^{\mathrm{disp}} + (1 - R_{\mathrm{tot}})\, Y_i, \]Comparison of effective tax rate
The Effective Tax Rate (ETR) is defined as total tax paid divided by gross income.
The following are plots of the ETR versus the pre-tax,pre-transfer income for various households, allowing for a comparison between VoTa and the Australian Government:
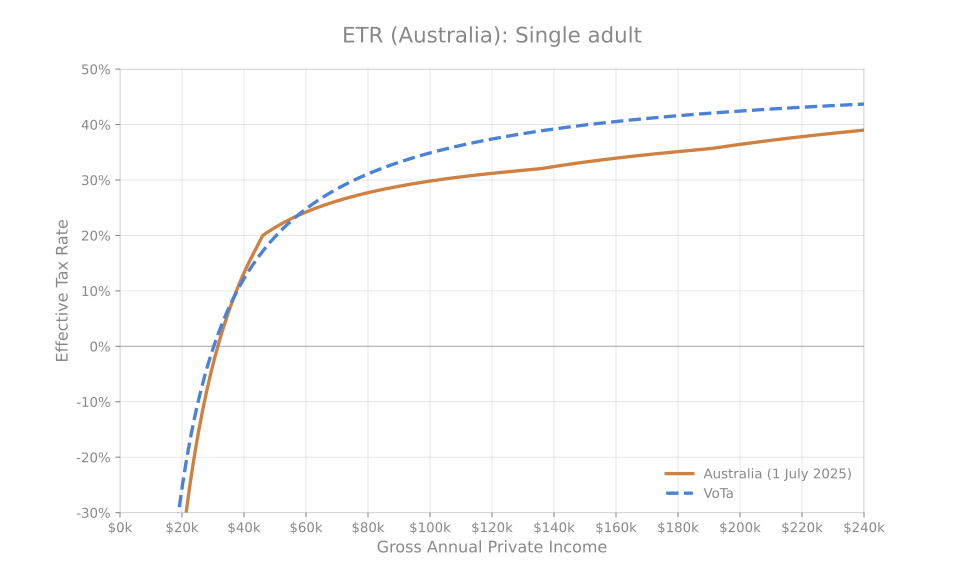
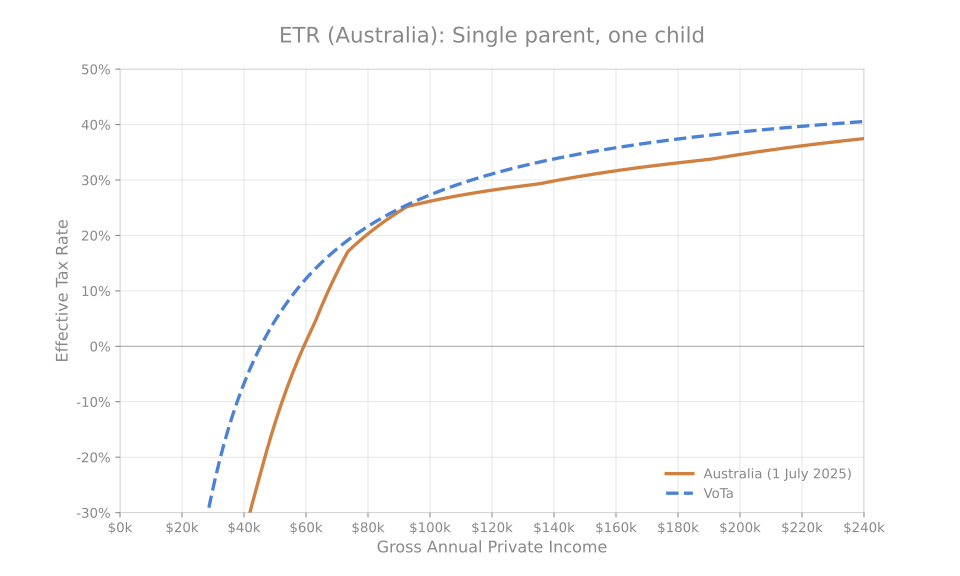
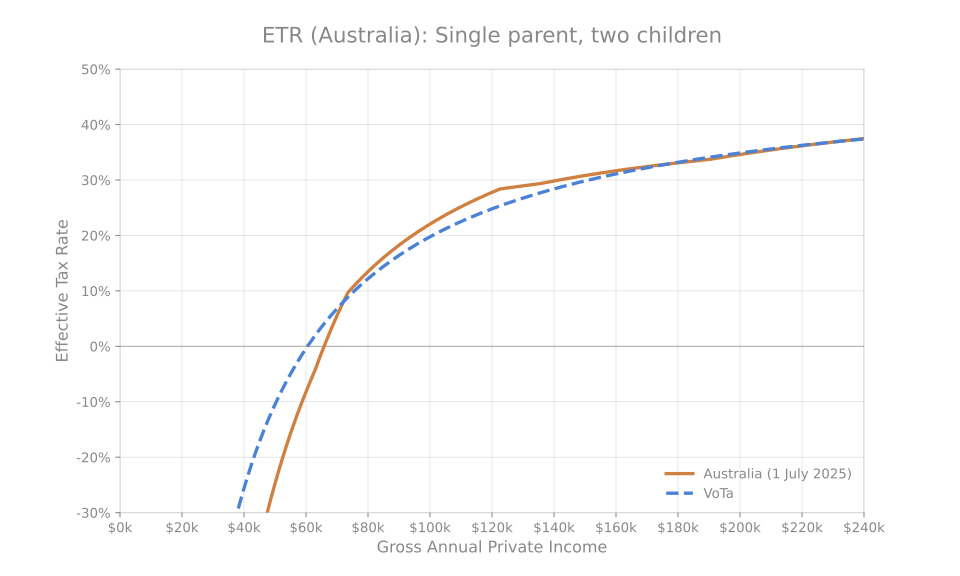
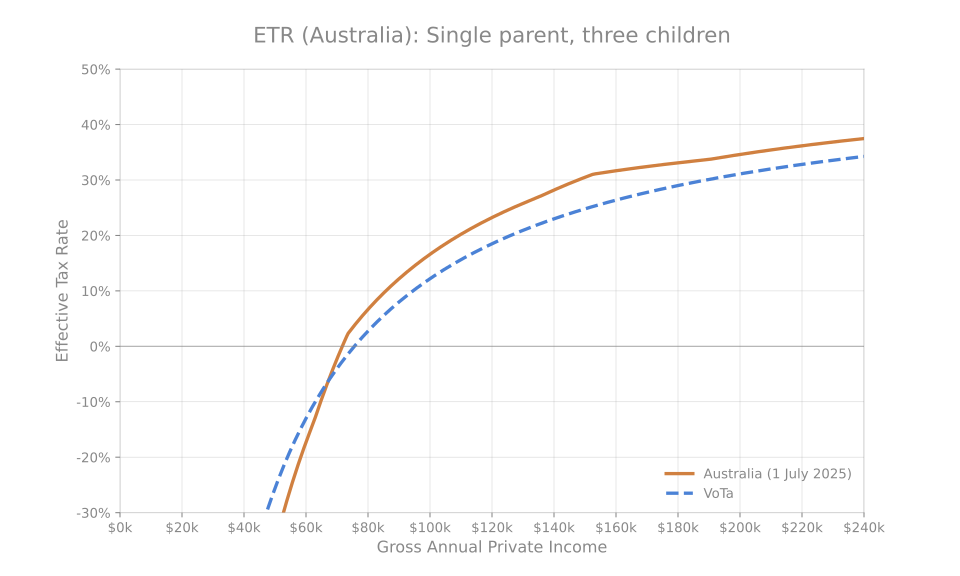
In VoTa, UBI is part of the tax system and functions as a negative tax offset. This makes the effective tax progressive, even though the underlying consumption tax rate \(R_{\mathrm{tot}}\) is flat. The expression for \( \text{ETR}_i \) is a non-linear function of the gross income \(Y_i\):
\[ \text{ETR}_i = R_{\mathrm{tot}} - \frac{U^{\mathrm{disp}}}{Y_i}. \]The ETR is lower for low‑income individuals and approaches \(R_{\mathrm{tot}}\) as income grows. A flat consumption tax combined with a uniform UBI therefore produces a progressive effective tax schedule, comparable in shape to the Australian income‑tax system.
Flat taxes are not progressive
Flat taxes are widely criticised for not being progressive. For example:
- The Pitfalls of Flat Income Taxes
by Carl Davis and Eli Byerly-Duke.
They state:
Ultimately, flat taxes are out of step with public concern about inequality and enacting one all but abandons even the possibility of an equitable tax system.
- The flat tax is not a fair tax by John F. Coverdale (1996).
In summary, current flat tax proposals are unfair both because they tax only wage income, exempting altogether income from capital, and because, in my view, fairness requires that the rate of tax increase as income increases.
- flat tax by Allen Hall.
The main criticism leveled against the flat tax is that it is unfair. Such a system, say opponents of the tax, would result in a windfall for the rich and higher tax burdens for the poor and the middle class, who are less able to afford them.
- Kemi Badenoch (UK Conservative leader): See Flat tax rate is an ‘attractive idea’, Kemi Badenoch says While not a direct quote calling flat taxes regressive, the reporting around her remarks frames the debate explicitly in terms of progressive vs. regressive taxation. The article notes that critics argue a flat tax “disproportionately benefits the wealthy and exacerbates income inequality by placing a heavier burden on lower‑income earners.”
- Is a flat-rate income tax a good idea? by John Sloman (economist and textbook author):
Sloman’s article explains the taxonomy of taxes:
A regressive tax is one where “the average rate of tax fell as incomes rose.”
A flat‑rate income tax with no allowances is described as a proportional tax, but the article
contrasts it with progressive systems and explains why critics view flat taxes as unfair to
lower‑income earners.
The main argument against moving from a progressive to a flat-rate income tax in an advanced country, such as the UK, is that is would involve a large-scale redistribution of income from the poor to the rich.
- The FasterCapital article summarises the standard economic critique: Critics argue a flat tax “disproportionately benefits the wealthy and exacerbates income inequality by placing a heavier burden on lower‑income earners.”
- The VersyTalks discussion summarises the conceptual distinction: See Flat tax rate for all or progressive taxation? A regressive tax “impacts lower‑income individuals more heavily.” Progressive taxation is framed as distributing the burden “according to ability to pay.”
- The Flat Tax is Good, but Common Sense is Better by Casey B. Mulligan 1996.
- Is a Flat Tax Regressive or Just Proportional? by LegalClarity Team 2026.
A flat tax charges every taxpayer the same percentage rate, which makes it proportional on paper. but the practical effect is regressive because lower-income households lose a far larger share of their usable income than wealthy ones do.
- What are progressive and regressive taxes?
by Peter Varela, Australian National University 2016.
The GST is an interesting and important case. When the GST is examined as a proportion of income, the GST is found to be a regressive tax, even though the GST is applied at a constant rate of 10 per cent. This is because people with higher incomes tend to spend less (and save more) of their income than people with lower incomes, which results in less GST being paid as a percentage of the income of higher income earners.
The invalid claim by Peter Varela that a flat consumption tax is regressive is not uncommon. The argument is that low‑income households consume nearly all their income so they pay GST on nearly all of it, whereas high‑income households save a large share so they pay GST on a smaller fraction of their income. Therefore, it is claimed GST as a percentage of income falls as income rises, so it is “regressive”. But notice the sleight of hand, the tax is measured against income, not the tax base. Money only has utility when it is eventually spent. A person who saves today will spend later (or their heirs will). A flat consumption tax is therefore proportional over a lifetime, even if it looks “regressive” in a single year.
UBI seems regressive
Some people argue that giving everyone a UBI, even the wealthy, is unfair, because the poor are the ones that need help, not the rich.
For example:
- Universal basic income is regressive
Senior Minister Tharman Shanmugaratnam 2020.
A universal basic income (UBI) is regressive and means that large numbers of people have to be taxed more heavily. The idea of giving everyone (the same) quantum of money is very different from giving the poor and the lower-middle-income group the support they need. Secondly, to give the poor what they need through UBI, you've got to give everyone that same higher amount. In other words, you don't just flatten the curve but you've got to raise the curve. That needs much more taxes. And if we do the arithmetic, it can't just be taxes on the rich. You need much more taxes on the middle-income group in order to give everyone the amount of benefits that the poor actually need.
- How Seriously Should We Take Universal Basic Income?
by Simon Szreter.
Though UBI is widely considered a putative solution to poverty, it does little to redress the structural inequalities that cause poverty. This is because, at its heart, UBI is a cash transfer that perpetuates, rather than reduces, the powerful corporate and financial forces of inequality that have kept the poorest citizens disempowered, unable to reform the world’s capital systems, which continue to wreak havoc on the environment.
Importantly, adopting UBI as a national policy would be so expensive that its costs would displace a range of alternative resource-using policies that can redress absolute poverty while also reducing inequality. - Why the progressive left should oppose a universal basic income
by Emma Dawson 2020.
The problem is, a UBI does little to actually reduce inequality, and carries real risks to the social contract that has been built up over generations.
Essentially, the UBI is just another measure to funnel the products of our national economy into the hands of those who control the means of production. It exacerbates the concentration of capital amongst those at the very top of our economic system.
A paradox
And here lies a paradox: no one says a flat tax is progressive, and no one says UBI is progressive. Yet when combined, the two mechanisms clearly redistribute wealth from rich to poor. The combination is clearly progressive.
The UBI must be combined with universal services to help the poor
The Australian Government provides far greater welfare support than VoTa UBI for households that require child-care support and rent assistance.
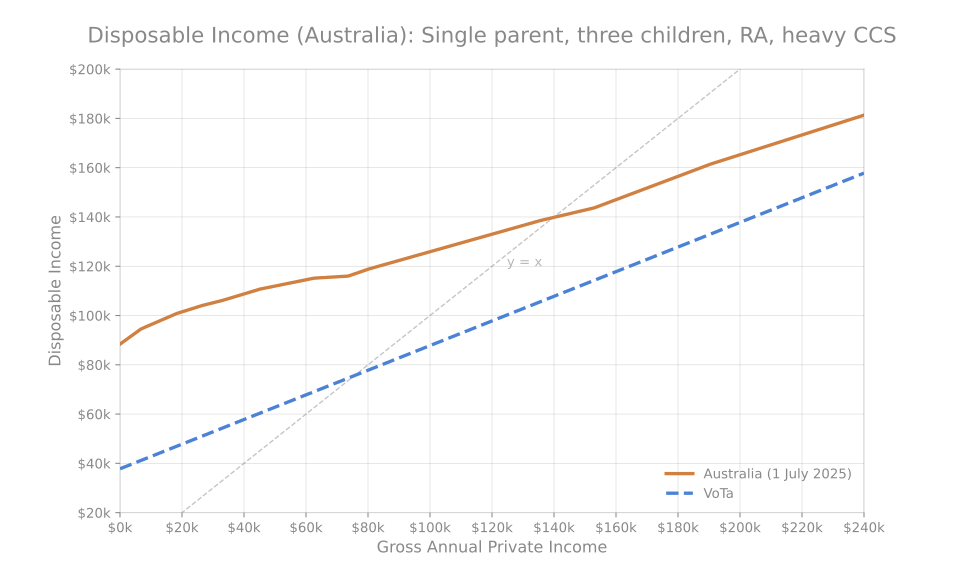
Although UBI replaces the monetary transfer role of welfare, it is not designed to guarantee a life free from poverty. A UBI alone is insufficient for people facing high structural costs, such as homelessness, unemployment, or single parents with low wages who must pay rent and child‑care fees. Under VoTa, these needs are met not by increasing UBI but by providing universal public services that supply a free or subsidised baseline of food, shelter and child care to anyone who chooses to use them.