7.1 Bureaucracy in Australia
In Australia: The World’s Most Bloated Bureaucracy, John Anderson and former New South Wales Senior Trade and Investment Commissioner Mike Newman argue that Australia's public service has become bloated, self-serving, and hostile to the productive economy. They point to the extraordinary share of newly created jobs absorbed by government, the proliferation of highly paid bureaucratic positions, and the red, green, and black tape that deters businesses from investing in Australia. Cost blowouts and failed projects are presented not as isolated mistakes but as symptoms of institutions that face weak consequences for failure and acquire a vested interest in expanding their own power. Their central criticism is that the bureaucracy no longer confines itself to serving the public: it consumes resources created elsewhere, obstructs those who create wealth, and seeks ever more authority over the people whose liberty it ought to protect.
Newman states that his company was considering 62 jurisdictions for future investment and made approximately 40% of its profits in Australia. He says that the company was finding it increasingly difficult to justify further investment in Australia because of red, green, and black tape.
Homelessness
The interview
The interview cites 128,000 people experiencing homelessness in Australia. Newman contrasts this figure with a social-media video in which Minister for Housing and Homelessness Clare O'Neil and Murray Watt discussed their preferences among a börek, a jam doughnut and a cinnamon roll. He describes the video as social-media virtue signalling and questions what public value it produced while Australia faced record homelessness. He then contrasts the scale of the public service with its results and says that government should be concerned with good government, changing the culture of the public service and measuring actual outcomes. Interview excerpt and transcript
Changes over three decades
Research reported by the Australian Institute of Health and Welfare estimated that between 15,000 and 19,000 homeless people aged 12 to 24 were in Australia in May 1991. The estimate used Victorian Supported Accommodation Assistance Program data, other service records and national population data. AIHW source
The 1996 Census was the first Australian Census to use a special strategy targeting the homeless population. An analysis published by the ABS estimated 105,304 homeless people on Census night in 1996, equivalent to approximately 59 per 10,000 population. That estimate used the earlier cultural definition of primary, secondary and tertiary homelessness. The ABS developed its current statistical definition in 2012 and produced the series beginning in 2001 shown below. ABS 1996 estimate ABS history and definitions
The Australian Bureau of Statistics estimates homelessness from each five-yearly Census. The national estimates and rates in its current series were:
- 2001: 95,314 people, or 50.8 people per 10,000 population.
- 2006: 89,728 people, or 45.2 per 10,000.
- 2011: 102,439 people, or 47.6 per 10,000.
- 2016: 116,427 people, or 49.8 per 10,000.
- 2021: 122,494 people, or 48.2 per 10,000.
Between 2001 and 2021, the estimated number increased by 27,180 people, or 28.5%, while the rate declined from 50.8 to 48.2 per 10,000 population. Over the decade from 2011 to 2021, the number increased by 20,055, or 19.6%, and the rate increased from 47.6 to 48.2 per 10,000. Between 2016 and 2021, the number increased by 6,067, or 5.2%, while the rate declined from 49.8 to 48.2 per 10,000.
Composition in 2021
- 47,895 people lived in severely crowded dwellings.
- 24,291 lived in supported accommodation for people experiencing homelessness.
- 22,137 lived in boarding houses.
- 16,597 stayed temporarily with other households.
- 7,636 lived in improvised dwellings or tents, or slept out.
- 3,934 lived in other temporary lodging.
The 2021 Census was conducted on 10 August 2021 while COVID-19 restrictions and emergency-accommodation programs were operating. The ABS states that the 2021 estimates are not directly comparable with earlier Censuses because greater use of administrative data improved data quality. The categories above are mutually exclusive and the ABS applies small random adjustments to cells to protect confidentiality. ABS Census source AIHW trend summary
Size of laws and regulations in Australia
Commonwealth laws in force
The Australian Law Reform Commission's DataHub reported the following figures as at 12 December 2022:
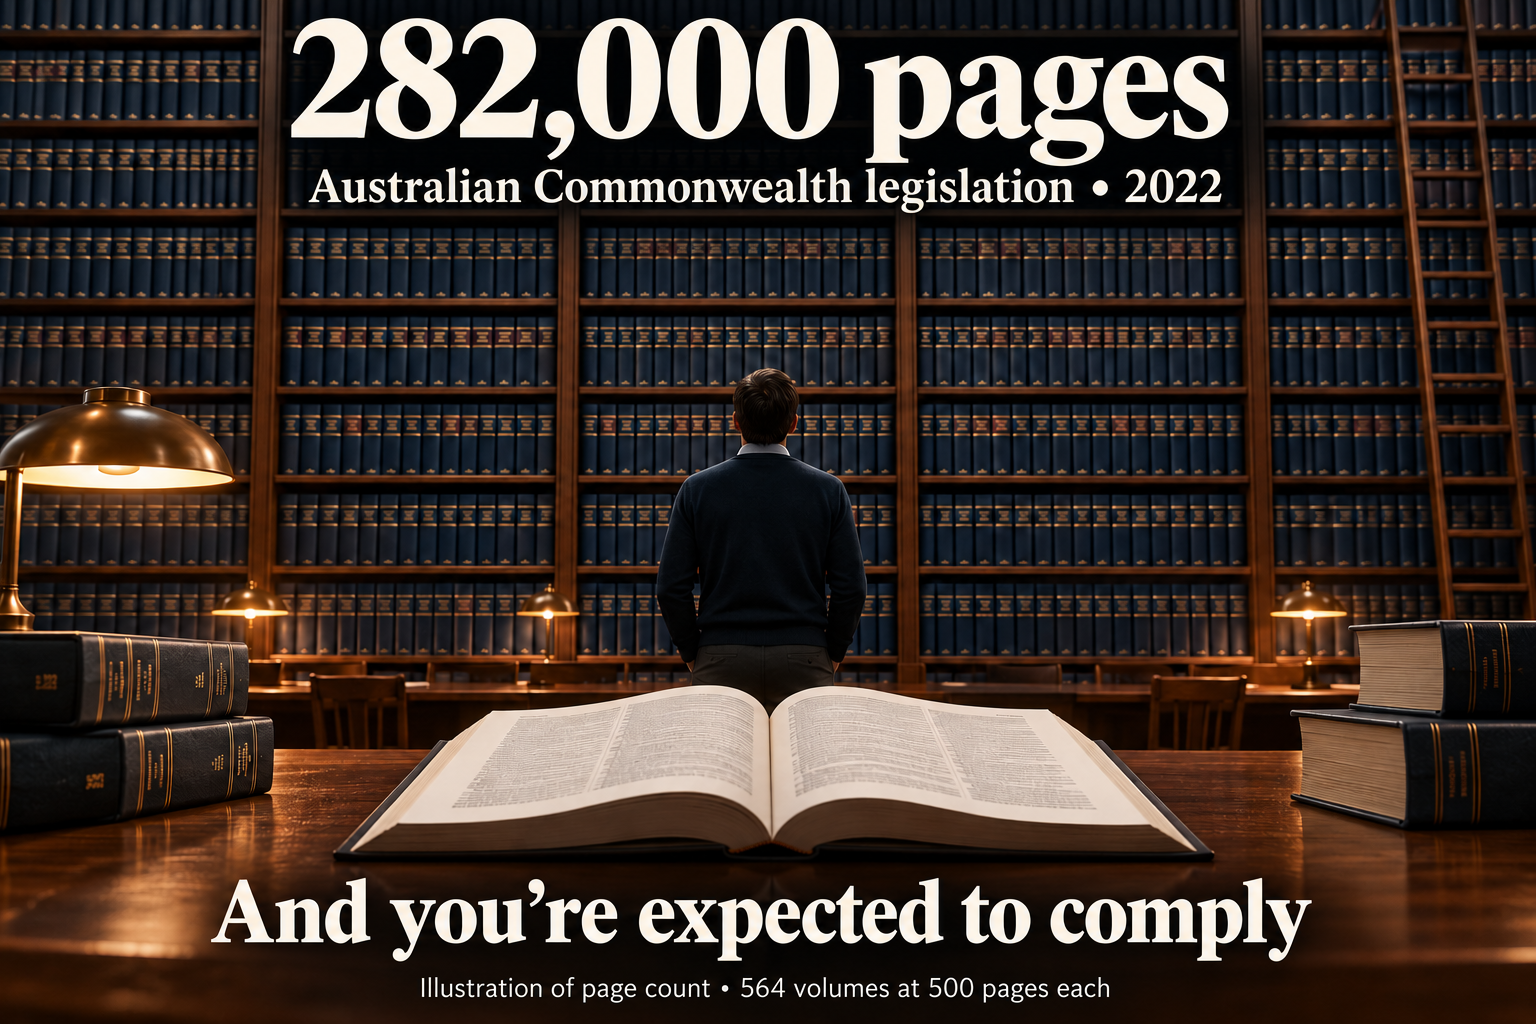
- Commonwealth legislation in force occupied more than 282,000 pages.
- It comprised more than 1,220 Acts and 17,600 pieces of delegated legislation, including regulations, rules and determinations.
- The Acts alone contained 21,848,187 words. The ALRC calculated that reading those Acts would take more than 1,400 hours; that calculation excluded delegated legislation.
- More than 5,400 Acts and legislative instruments dealt with corporations and financial services.
- The Acts contained more than 49,000 defined terms, more than 6,600 references to committing or being guilty of an offence, and more than 1,650 civil-penalty provisions.
These are Commonwealth figures and do not include the statute books of the six states and two self-governing territories. Source
Volume produced
- During the 46th Parliament, from 2 July 2019 until 11 April 2022, more than 110,000 pages of Commonwealth Acts and delegated legislation were made.
- Acts accounted for less than 15% of those pages; delegated legislation accounted for more than 85%.
- Across recent Parliaments, approximately 400 Acts were passed per parliamentary term.
- Only 14 successful private members' bills were recorded from the beginning of the 39th Parliament on 10 November 1998 through the dissolution of the 46th Parliament on 11 April 2022.
The ALRC figures are organised by parliamentary term. Separately, the Parliamentary Education Office states that usually 100 to 200 bills are introduced each year and approximately 90% are passed. The House of Representatives' annual series records 145 bills introduced and 140 assented to in 2024; 167 introduced and 121 assented to in 2023; and 169 introduced and 96 assented to in the 2022 election year. ALRC source Parliamentary Education Office source House of Representatives annual series
Growth and complexity
- A total of 941,005 pages of Commonwealth Acts and regulations were made between 1901 and 2021. This is a cumulative historical total, rather than the number remaining in force.
- More than 13,200 Commonwealth Acts and more than 87,500 legislative instruments were made from 1901 to 2021.
- Since 1965, 210 Acts or regulations were at least 400 pages long; only two had reached that length before 1965.
- The Corporations Act 2001 was 1,866 pages when made and had grown to more than 3,900 pages by 2021.
- The Corporations Regulations 2001 exceeded 1,300 pages. The corporations and financial-services regime also included more than 270 ASIC legislative instruments, 200 regulatory guides and 200 information sheets.
- Financial-product-disclosure law included more than 45,000 words in the Corporations Act, another 65,000 words in regulations and tens of thousands of words in other legislative instruments.
- The Corporations Act contained more than 1,000 unique defined terms and 14,500 internal cross-references. More than 570 terms were defined more than once; “property” had 17 definitions and “securities” had five meanings.
- More than 100 legislative instruments notionally amended the Corporations Act, including more than 20 that applied generally rather than to a named person or entity.
Historical volume source Corporations Act source Corporations and financial-services complexity source
All Australian jurisdictions
Australia has nine legislative jurisdictions: the Commonwealth, six states and two self-governing territories. In 2016, the commercial LawOne research service reported that its national collection contained more than 65,000 legislative items across all nine jurisdictions. Its collection included current, amending, subordinate and repealed legislation as well as bills, explanatory memoranda and second-reading speeches, so 65,000 was a database-coverage figure rather than a count of legislation then in force. No authoritative aggregate page count or digital file-size measure covering the laws in force in all nine jurisdictions was identified. Source
Conformance costs
The real economic cost of laws and regulations is a counterfactual: it depends on what households, businesses and institutions would have done if thousands of pages of regulations had not existed. That alternative is unknown and cannot be observed. Economy-wide figures are therefore modelled scenarios with very little confidence in their accuracy.
Studies of regulation generally use the term compliance costs for the time and money spent understanding, documenting and demonstrating conformity with legal requirements. These costs include paperwork, record keeping, reporting, applications, professional advice and changes to business processes. These visible costs omit regulation's unknown wider effects on business formation, entrepreneurship, investment, competition, innovation, productivity and economic progress. They also do not subtract any benefits produced by regulation.
Aggregate estimates
- Australian Government stocktake: A stocktake based on regulation in place in October 2013 estimated that complying with Commonwealth regulation cost $65.39 billion annually, equivalent to approximately 4.2% of GDP. The Treasury portfolio accounted for $47.0 billion, including approximately $40 billion attributed to the tax system and $6.3 billion to corporate and financial-sector regulation. The Australian National Audit Office reported that sampling methods differed between portfolios, making the portfolio estimates not directly comparable. Source
- Mandala Partners and the Australian Institute of Company Directors: Research published in November 2025 estimated an annual cost of $160 billion for meeting Commonwealth regulation, equivalent to 5.8% of GDP. The research reported that compliance-specific roles doubled between 2010 and 2024 and that annual salary expenditure for those roles increased from $1.9 billion to $5.7 billion. It also reported that the share of board time devoted to compliance increased from 24% to 55% over ten years. The study was commissioned by the Australian Institute of Company Directors. Source
- Institute of Public Affairs: The IPA estimated that red tape reduced annual economic output by $176 billion, approximately 10% of GDP at the time of the study. This estimate includes modelled opportunity costs such as businesses, jobs, investment and production that did not occur, rather than only money spent on compliance. Source
Reported effects on businesses and projects
- An Australian Chamber of Commerce and Industry survey found that 53.3% of participating businesses spent more than $10,000 on regulatory compliance in 2014. It found that 54.9% could not pass any of their direct compliance costs on to customers.
- A later ACCI survey reported that 73% of respondents believed red tape had increased during the preceding year, while 47.2% reported that regulation had prevented them from making changes intended to grow their business.
- The Minerals Council of Australia submitted to a Senate inquiry that regulatory delays affecting a major greenfield mining project could cost up to $46 million for each month of delay.
The Senate Select Committee on Red Tape reported in 2018 that there was no comprehensive independent study of the productivity and economic effects of the Commonwealth Deregulation Agenda. It distinguished necessary regulation from red tape, which it described as the part of regulation that imposes an unnecessary burden. The committee also noted that direct compliance costs are easier to quantify than wider effects such as delayed or abandoned investment. Source
Measured savings from deregulation
The Australian Government reported that more than 1,500 decisions implemented from September 2013 had produced an estimated $5.2 billion in net annual regulatory-cost reductions by 2017. A further approximately 190 reported decisions with estimated net savings of $710 million had not then been implemented. These figures were estimates made under the government's Regulatory Burden Measurement Framework; they measure changes in compliance costs attributed to specified decisions rather than the total effect of regulation on economic output. Source
Australian real GDP per capita
Real GDP per capita measures inflation-adjusted economic output per person. The Australian Bureau of Statistics' chain-volume series shows that it increased from $59,714 in 1989–90 to $99,150 in 2024–25. This was an increase of 66.0% over 35 years, equivalent to compound growth of approximately 1.5% a year.
Long-term changes
- 1989–90: $59,714 per person.
- 1999–2000: $74,133, an increase of 24.1% over the preceding decade.
- 2009–10: $86,847, an increase of 17.1% over the preceding decade.
- 2018–19: $95,586, an increase of 10.1% over the preceding nine years.
- 2024–25: $99,150, an increase of 3.7% over the preceding six years.
The average annual rate of increase slowed across these periods: approximately 2.2% from 1989–90 to 1999–2000, 1.6% from 1999–2000 to 2009–10, 1.1% from 2009–10 to 2018–19, and 0.6% from 2018–19 to 2024–25.
Recent changes
- 2019–20: real GDP per capita fell by 1.6%, to $94,058.
- 2020–21: it increased by 1.6%, to $95,533.
- 2021–22: it increased by 3.7%, to $99,044.
- 2022–23: it increased by 1.4%, reaching $100,463.
- 2023–24: it fell by 1.0%, to $99,448.
- 2024–25: it fell by 0.3%, to $99,150.
Real GDP per capita therefore declined for two consecutive financial years after reaching its highest level in the series in 2022–23. By 2024–25 it was 1.3% below that peak. Total real GDP nevertheless increased by 1.4% in both 2023–24 and 2024–25 because total output grew while output per person declined. The national-accounts series records these changes but does not assign them to regulation or to any other particular cause. ABS source
Effective tax burden over time
The conventional economy-wide measure is total taxation revenue as a percentage of GDP. Because GDP includes public expenditure, an alternative measure compares tax revenue with expenditure outside the public sector. The calculation used here is:
Adjusted tax burden = total taxation revenue / (GDP − general-government final consumption − public gross fixed capital formation).
This denominator approximates C + private I + X − M. Public gross fixed capital formation includes investment by general government and public corporations. The resulting percentage is an economy-wide ratio, not the effective tax rate faced by a particular household or business.
Economy-wide taxation, expenditure and debt
| Financial year | Tax / GDP | Government consumption and public investment / GDP | Tax / non-government expenditure | General-government net debt / GDP |
|---|---|---|---|---|
| 1968–69 | 21.8% | 21.6% | 27.8% | — |
| 1978–79 | 26.0% | 24.6% | 34.5% | — |
| 1988–89 | 29.6% | 23.7% | 38.7% | — |
| 1998–99 | 30.1% | 23.5% | 39.4% | 13.8% |
| 2000–01 | 31.9% | 22.7% | 41.3% | 6.0% |
| 2001–02 | 30.4% | 22.7% | 39.3% | 4.6% |
| 2007–08 | 29.5% | 23.1% | 38.3% | −6.4% |
| 2013–14 | 27.1% | 23.3% | 35.3% | 17.6% |
| 2015–16 | 27.9% | 24.5% | 37.0% | 23.4% |
| 2019–20 | 27.7% | 26.9% | 37.9% | 31.9% |
| 2020–21 | 28.4% | 27.4% | 39.1% | 37.7% |
| 2021–22 | 29.2% | 27.0% | 40.0% | 33.3% |
| 2022–23 | 29.3% | 26.4% | 39.8% | 30.4% |
| 2023–24 | 29.9% | 27.7% | 41.4% | 31.6% |
| 2024–25 | 30.2% | 28.8% | 42.4% | 34.4% |
The adjusted ratio increased from 27.8% in 1968–69 to 38.7% in 1988–89 and 42.4% in 2024–25. From 2015–16 to 2024–25 it increased by 5.4 percentage points, while tax revenue as a share of GDP increased by 2.3 percentage points. Over the same period, general-government consumption and public investment increased from 24.5% to 28.8% of GDP.
General-government net debt moved from −6.4% of GDP in 2007–08, when the financial assets counted in the measure exceeded its debt liabilities, to 17.6% in 2013–14 and 23.4% in 2015–16. It therefore increased by 29.8 percentage points of GDP between 2007–08 and 2015–16, before increasing by a further 11.0 percentage points to 34.4% in 2024–25.
The figures combine the ABS total-taxation series with current-price national-accounts series. Tax data through 1988–89 were recorded on a cash basis, while the 1998–99 and later figures use accrual accounting, creating a break in the historical tax series. The adjusted percentages are calculations from ABS data rather than a separately published ABS indicator. The debt column is the ABS all-Australia general-government net-debt measure, covering the Commonwealth, state and local levels. Net debt subtracts selected financial assets from debt liabilities; it is a stock measured at the end of each financial year, rather than expenditure during that year. Historical taxation source 2000–01 and 2001–02 taxation source Recent taxation source National accounts source Historical debt source Recent debt source
Modelled tax burden on a median full-time earner
The following calculation represents a single Australian resident adult earning the ABS median weekly earnings of full-time employees, annualised over 52 weeks. It applies the resident income-tax schedule, the low-income tax offsets available at that income and the standard Medicare levy for the corresponding financial year. It assumes no dependants, deductions, HELP debt, private-health-insurance surcharge or other offsets.
| Financial year | Median full-time earnings | Income tax | Medicare levy | Modelled consumption tax | Combined tax / gross earnings |
|---|---|---|---|---|---|
| 1988–89 | $20,800 | $4,321 | $260 | $438 WST | 24.1% |
| 1998–99 | $31,200 | $6,630 | $468 | $651 WST | 24.8% |
| 2004–05 | $41,600 | $8,652 | $624 | $1,587 | 26.1% |
| 2008–09 | $51,769 | $9,202 | $777 | $2,052 | 23.2% |
| 2010–11 | $54,600 | $9,414 | $819 | $2,177 | 22.7% |
| 2013–14 | $59,904 | $10,914 | $899 | $2,361 | 23.7% |
| 2015–16 | $63,960 | $12,293 | $1,279 | $2,474 | 25.1% |
| 2018–19 | $69,784 | $13,179 | $1,396 | $2,710 | 24.8% |
| 2020–21 | $74,620 | $13,433 | $1,492 | $2,930 | 23.9% |
| 2024–25 | $88,400 | $17,308 | $1,768 | $3,403 | 25.4% |
For 2000–01 onward, the consumption-tax model assumes that the earner spends 90% of income remaining after income tax and the Medicare levy, and that 60% of that spending is on supplies subject to 10% GST. Because prices include GST, the GST component is one-eleventh of taxable spending. For 1988–89 and 1998–99, before the GST commenced, the model applies a 3% effective wholesale-sales-tax burden to 90% of income remaining after direct tax. Wholesale sales tax had multiple rates and exemptions and was imposed earlier in the supply chain, so this is a standardised effective rate rather than the statutory rate on every purchase. The model excludes excise, customs duties, stamp duty, council rates, taxes embedded in business costs other than the modelled WST, and compulsory superannuation.
On these assumptions, the combined rate was 24.1% in 1988–89, 24.8% in 1998–99 and 26.1% in 2004–05. It declined to 22.7% in 2010–11 and then ranged between 23.7% and 25.4% at the selected benchmarks through 2024–25. The 2018–19 and 2020–21 calculations include the low and middle income tax offset then available; the 2024–25 calculation applies the resident rates commencing on 1 July 2024. 2013 earnings source 2015 earnings source 2004–20 earnings table Recent and historical earnings source Historical income-tax schedules 2024–25 income-tax schedule Wholesale sales-tax source
Housing affordability in Australia
Housing affordability cannot be represented by real GDP per capita. Measures relevant to a prospective buyer include the dwelling-price-to-income ratio, the deposit required, interest rates and mortgage repayments. For existing owners and renters, the share of household income spent on mortgage or rent payments is also relevant.
Dwelling prices relative to income
- In 1981–82, the nationwide median dwelling price was approximately $48,000 and median after-tax household income was approximately $15,000. The dwelling cost a little more than three years of household income.
- In the mid-1990s, the median house price was approximately three times average annual household income.
- By the end of 2003, the median house price was approximately six times average annual household income.
- Between December 2011 and December 2024, the mean price of residential dwellings increased by 104%. Median household disposable income increased by 56% between 2011–12 and December 2024.
The Reserve Bank's historical series shows that dwelling-price-to-income ratios were comparatively stable in the early and mid-1980s, increased in the late 1980s, the 1990s and the early 2000s, and reached a record level in the series in 2017. The later income and dwelling-price figures show that prices again grew substantially faster than household income between 2011 and 2024. A deposit calculated as a fixed percentage of the purchase price rises with the dwelling price, irrespective of the interest rate subsequently charged on a mortgage. RBA long-term series RBA 1990s and 2003 comparison AIHW 2011–2024 comparison
Home ownership
- The proportion of Australian households owning their home was 70% in 2006 and 67% in the 2021 Census.
- Among households whose reference person was aged 25 to 29, ownership declined from 50% in 1971 to 36% in 2021.
- Among households whose reference person was aged 30 to 34, ownership declined from 64% in 1971 to 50% in 2021.
- Among those aged 50 to 54, ownership declined from 80% in 1996 to 72% in 2021.
- Of households with known tenure in the 2021 Census, 32% owned their home outright, 35% owned with a mortgage and 31% rented.
The overall ownership rate remained between 67% and 70% from the early 1970s to 2021, while ownership fell markedly within younger age groups. The age-specific figures distinguish changes in access to ownership from the effect of an ageing population on the national total. AIHW source
Mortgage and rental costs
- After adjustment for inflation, average weekly housing costs increased by 40% for owners with a mortgage and by 50% for private renters between 1999–2000 and 2019–20.
- In 2019–20, housing costs averaged 15.5% of gross household income for owners with a mortgage and 20.2% for private renters.
- For lower-income households in 2019–20, average housing costs consumed 27% of gross income for owners with a mortgage and 32% for private renters. Among lower-income private renters, 58% spent more than 30% of gross income on housing.
- The HILDA series shows average mortgage payments increasing from 15.5% of the gross income of mortgagor households in 2003 to 19.6% in 2008, falling to 13.8% in 2021, and increasing to 16.1% in 2023.
- For private-renter households, average rent increased from 18.9% of gross household income in 2003 to 20.6% in 2011, was 18.9% in 2021 and increased to 19.8% in 2023.
Payment-to-income averages describe households that already have a mortgage or tenancy. They do not measure the dwelling price or deposit confronting a prospective first-home buyer, and the national averages combine households with different incomes, loan ages, locations and housing costs. ABS 1999–2000 to 2019–20 source ABS and HILDA 2003–2023 series
Public-sector jobs
Voting preferences of government employees
Australian Election Study surveys show that government employees gave a larger combined share of their first-preference votes to Labor and the Greens than those parties received nationally in the 2010, 2013 and 2016 federal elections:
- 2010: 48% of government employees surveyed reported voting Labor and 14% reported voting Greens, a combined 62%. Labor and the Greens received a combined 49.8% of first-preference votes nationally, a difference of 12.2 percentage points.
- 2013: 39% reported voting Labor and 12% Greens, a combined 51%. The corresponding national share was 42.0%, a difference of 9.0 percentage points.
- 2016: 38% reported voting Labor and 11% Greens, a combined 49%. The corresponding national share was 45.0%, a difference of 4.0 percentage points.
The government-employee figures are self-reported votes from post-election sample surveys, whereas the national figures are the election results. The association was present in all three elections but narrowed across the period. It establishes that the government employees surveyed voted more heavily for Labor and the Greens; it does not by itself establish that public agencies acted with partisan bias. 2010 Australian Election Study analysis 2013 Australian Election Study analysis 2016 Australian Election Study analysis 2010 AEC results 2013 AEC results 2016 AEC results
Administrative proposals and duplication
Newman describes a draft proposal prepared within his former department for a Net Zero Economy Office. He says that the proposal comprised 50 pages and requested $49.9 million over four years. Approximately 30 pages supported proposed salaries accounting for about $27 million of the total. The section addressing the commercial work that the proposed centre of excellence would perform occupied less than half a page and contained no numerical measures. Newman also says that four or five groups across New South Wales government departments and agencies were working on hydrogen, while only one of those groups was speaking with customers and facilitating investment. The draft proposal is not publicly available, so these details are Newman's account of the document he reviewed. Interview at 35:05
Totals
The Australian Bureau of Statistics recorded 2,597,300 public-sector employee jobs in June 2025. Of these, 385,900 were Commonwealth government jobs, including defence personnel; 1,993,400 were state government jobs; and 218,000 were local government jobs. Source
Australia had 15,971,100 filled jobs in the June quarter of 2025. The 2,597,300 public-sector employee jobs recorded for June were equivalent to approximately 16.3% of that total. State governments accounted for 76.7% of public-sector jobs, the Commonwealth for 14.9%, and local governments for 8.4%. Source
Comparison with Japan
Newman compares Australia's 2.6 million public-sector jobs and approximately $250 billion annual public-sector wage bill with Japan's approximately 3.4 million public employees. He describes the Japanese payroll as costing roughly the same amount and notes that Japan has approximately five times Australia's population. On that basis, he says Japan operates with approximately 40% as many public employees per resident as Australia. Interview at 5:48
The ABS recorded 2,597,300 Australian public-sector employee jobs in June 2025 and $249.5 billion in cash wages and salaries during 2024–25. Japan's National Personnel Authority recorded approximately 3.407 million public employees: 593,000 national and 2.814 million local employees. Japan therefore had approximately 31% more public employees, despite having approximately 4.5 times Australia's population. Australian source Japanese employment source Australian population source Japanese population source
Japan's Ministry of Finance uses a narrower workforce of 2.912 million when reporting its FY2025 personnel budget: 585,000 national and 2.327 million local public employees. It budgeted ¥5.5 trillion for national personnel and ¥21.0 trillion for local personnel, a combined ¥26.5 trillion. At the Reserve Bank of Australia's exchange rate of ¥94.42 per Australian dollar on 20 June 2025, this was equivalent to approximately A$280.7 billion. The Australian and Japanese totals are similar in scale, but they are not directly equivalent: Australia counts employee jobs and includes public corporations, while the Japanese employment and personnel-expense publications use different scopes. Japanese personnel-cost source Exchange-rate source
International measures and definitions
A chart published by The Economist in April 2025, using ILOSTAT data, placed Australia at the top of its international comparison with approximately 143 public-sector employees per 1,000 residents. This was equivalent to approximately 14.3% of the population and 29% of employed people. The observations used in the underlying international dataset were the latest available for each country and did not necessarily relate to the same year. Source
The ILO public-sector definition covers government institutions, enterprises at least 50% owned by the state, and government-controlled non-profit institutions. The ABS figure above counts employee jobs attributed to Commonwealth, state and local public-sector employers using Australian payroll and business-register data. The ILO figure counts employed people, while the ABS publication counts employee jobs; a person may hold more than one job. Differences in institutional classification, collection methods, reference periods and whether people or jobs are counted affect the comparison between the figures. ILO definition ABS methodology
Government-funded employment
For measuring how much employment depends on government expenditure, government-funded employment is a more useful definition than classification by ownership of the employer. It includes direct government employees and the share of jobs in private businesses and non-profit organisations financed through government contracts, grants and payments for services. Australia does not publish a comprehensive count on this basis. Direct public-sector employment is equivalent to approximately 18% of the labour force, while the broader ILO estimate is approximately 29% of employed people. A reasonable estimate of government-funded employment is therefore around 25% to 30% of employment, but this is not an official statistic.
Public and private expenditure
In the 2024–25 financial year, government final consumption expenditure was $643.3 billion and public gross fixed capital formation was $157.8 billion, giving total public final expenditure of $801.1 billion. Household final consumption expenditure was $1.441 trillion and private gross fixed capital formation was $518.2 billion, giving total private final expenditure of $1.959 trillion. Public expenditure therefore represented approximately 29.0% of the $2.760 trillion combined domestic final expenditure represented by these categories. This expenditure share supports the plausibility of a government-funded employment estimate in the 25% to 30% range, but does not determine it: public and private expenditure can have different labour intensities, purchases can include imported goods, and transfer payments are recorded when their recipients spend them rather than as government final consumption. Source
For comparison, Statistics Norway recorded NOK 1.187 trillion of general-government final consumption and NOK 282.7 billion of general-government fixed investment in calendar 2024. These amounted to NOK 1.470 trillion, or approximately 31.7% of the NOK 4.634 trillion total formed by household and non-profit consumption, government consumption and gross fixed capital formation. Australia's comparable public share was approximately 29.0% in the 2024–25 financial year. The periods differ by six months, and the Norwegian investment figure covers general government rather than every government-owned corporation. The comparison shows a larger government share of domestic final expenditure in Norway, but a difference of approximately three percentage points rather than the much larger difference suggested by OECD general-government employment data. Source
Recent changes
Public-sector employee jobs increased by 82,000, or 3.3%, from June 2024 to June 2025. Source
Over the year to June 2025, private-sector filled jobs increased by 205,300 and public-sector filled jobs increased by 66,600. Public-sector jobs therefore accounted for approximately 24.5% of the combined increase. The three non-market industries—health care and social assistance, education and training, and public administration and safety—accounted for 62% of filled-job growth over the same year; these industries include both public- and private-sector jobs. Source
Victoria had 606,100 public-sector employee jobs in June 2024 and 616,900 in June 2025, an increase of 10,800 or 1.8%. Within that total, Victorian state-government jobs increased from 485,900 to 493,200, an increase of 7,300 or 1.5%. Source
Cost overruns
- North Sydney Olympic Pool: The project approved in 2020 had a budget of $63.8 million. Work began in March 2021 and was originally due to finish in November 2022. A forecast prepared in February 2024 put the total cost at $122 million; in February 2026, practical completion was expected in March 2026. Source
- Federal staffing costs: An Australian Financial Review analysis of 16 agencies' financial reports for 2024–25 found that 14 recorded unbudgeted staff-expense increases totalling $841 million. Source
- Suburban Rail Loop: The $216.6 billion figure is the Victorian Parliamentary Budget Office's 2024 nominal estimate for both building SRL East and North ($96.4 billion) and operating them through 2084 ($120.2 billion). A preliminary construction estimate of approximately $50 billion was reported when the entire loop was announced in 2018. Source
- Victorian major projects: For 2023–24, the Victorian Auditor-General reported that 53 of 113 major projects collectively exceeded their original budgets by $14.9 billion. Source
- Victoria 2026 Commonwealth Games: When Victoria contracted to host the Games in April 2022, the expected gross cost was approximately $2.6 billion. By July 2023 the government's estimate was $6 billion to $7 billion and it withdrew as host. In August 2023 it agreed to pay the Games bodies $380 million; the Victorian Auditor-General later calculated total cancellation costs of more than $589 million. Source
- Bureau of Meteorology website: The Bureau stated in November 2025 that the new website accounted for approximately $96 million of the ROBUST technology program, which began with funding in the 2017–18 Budget and closed in July 2024. The design component cost approximately $4 million. The $96 million covered the end-to-end technology chain. The Accenture contract was $78 million, including build and running costs through 2027. Source
- VNI West: AEMO's 2020 Integrated System Plan assumed a cost of $1.73 billion. In 2022, the preferred option was estimated at $3.256 billion nominal. By July 2025, Transgrid estimated the NSW portion alone at $3.7 billion. A 2025 estimate of $7.6 billion had an uncertainty range with an upper bound of $11.4 billion. Source
- CopperString: The government-funded project was estimated at $5 billion in 2023, $6.2 billion in September 2024 and $9 billion including contingencies in December 2024. In April 2025, an expanded scope including connections to mines and generators was estimated at $13.9 billion. Source
- Project Marinus: The two-stage project was estimated at $3.827 billion in 2020 dollars in its 2021 regulatory investment test. An April 2024 update estimated $6.575 billion in 2023 dollars. In September 2025, AEMO used a total cost of $7.57 billion: $5.035 billion for Stage 1 and $2.535 billion for Stage 2. Source