3.2 The democratic pressure for redistribution
The conflict arises when one considers the typical distribution of incomes in any free market. It does not follow a symmetric normal distribution. In a theoretical, perfectly frictionless free market, the expected distribution of incomes is typically modelled as a log-normal distribution for the vast majority of the population, which transitions into a Pareto distribution (power law) for the highest income earners. The bottom 90%–95% follows a log-normal distribution that is driven by proportional random growth. Income changes are usually percentage-based (e.g., a 3% raise), which naturally creates a right-skewed curve where most people sit near the average, but a significant number earn well above it. The top 1–5% follows a Pareto distribution, driven by preferential attachment ("the rich get richer") and scalability. At this level, returns on capital and global market reach allow a tiny fraction of the population to accumulate a massive share of the total wealth. For example, there is the "superstar" effect: modern technology and globalisation allow the top performers in a field (e.g., software engineers, CEOs, entertainers) to serve a global market. A slightly better product or service can capture 100% of the market, leading to massive income disparities between the best and the second-best.
A right-skewed distribution means that the mean income is somewhat larger than the median. This means that, even with a flat tax rate and universal benefits, far more than 50% of the population are net beneficiaries. Progressive taxes and targeted benefits for the poor only increase this effect.
This mechanism was formalised by Allan Meltzer and Scott Richard in their 1981 paper A Rational Theory of the Size of Government. Their median-voter model predicts that demand for taxation and redistribution increases as mean income rises relative to the income of the decisive voter.
This is not merely a theoretical result. The following latest available figures from the OECD show that mean annual equivalised household disposable income exceeds median income across a diverse group of countries. Because disposable income is measured after taxes and transfers, the skew remains even after existing redistribution.
| Country | Year | Mean income | Median income | Mean / median |
|---|---|---|---|---|
| Germany | 2023 | EUR 33,622 | EUR 30,237 | 1.11 |
| Sweden | 2024 | SEK 433,694 | SEK 381,157 | 1.14 |
| Australia | 2020 | AUD 64,923 | AUD 55,919 | 1.16 |
| United Kingdom | 2023 | GBP 29,429 | GBP 23,669 | 1.24 |
| United States | 2023 | USD 62,186 | USD 49,885 | 1.25 |
| Mexico | 2022 | MXN 121,813 | MXN 92,274 | 1.32 |
Source: OECD Income Distribution Database. Figures are in current national currencies per equivalised household. Currency conversion is unnecessary for the mean-to-median ratios.
The ratio of mean to median income does not by itself show how much of the population earns less than the mean. The World Bank's Poverty and Inequality Platform makes it possible to calculate that proportion directly from household survey income distributions. Across the same group of countries, approximately 60%–68% of the population has an income below the national mean:
| Country | Survey year | Mean / median | Population below mean |
|---|---|---|---|
| Sweden | 2023 | 1.13 | 59.6% |
| United Kingdom | 2021 | 1.18 | 61.9% |
| Germany | 2022 | 1.18 | 62.3% |
| Australia | 2020 | 1.22 | 63.2% |
| United States | 2024 | 1.33 | 64.6% |
| Mexico | 2024 | 1.40 | 68.1% |
Source: calculations using household survey data from the World Bank Poverty and Inequality Platform. For each country, its mean income was used as the income threshold and the platform's resulting poverty headcount was recorded as the proportion of the population below the mean. The years shown are the latest survey years available from the platform.
The following plot illustrates the Australian household income distribution. The curve is a stylised log-normal distribution calibrated to the mean-to-median ratio in the World Bank survey data. The empirical mean, median, and proportion of the population below the mean are taken from the same 2020 survey:
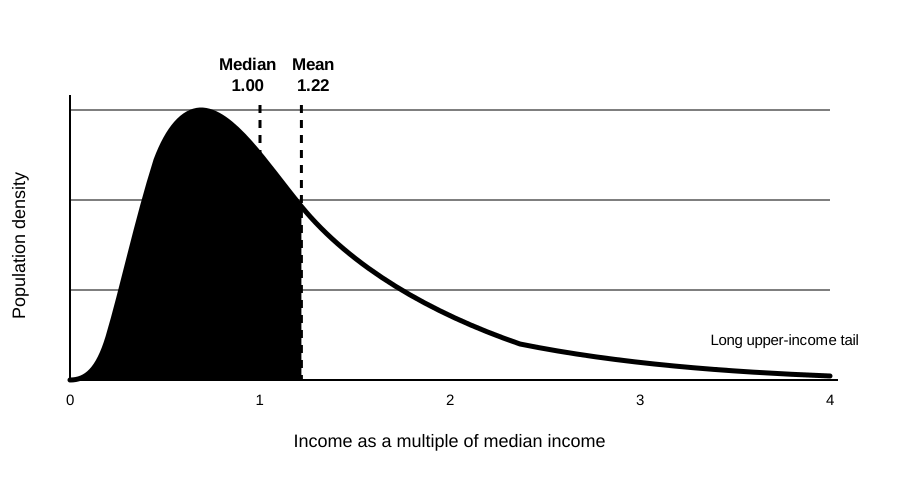
The data therefore confirm that the difference between mean and median income is substantial in practice. In these countries, the proportion below the mean is not merely greater than half, but greater by approximately 10–18 percentage points.
This creates a fundamental problem. Democracy gives each citizen an equal vote, while market incomes are distributed unevenly. When 60 per cent or more of the population can gain materially by taxing and redistributing income from a wealthier minority, democratic politics creates powerful and persistent pressure for greater taxation and redistribution. Progressive taxation and benefits targeted towards lower-income groups intensify that pressure. The natural tendency is therefore for democratic control of the State to expand at the expense of the free market.