Kyoto Cabinet ingestion rate measurement
Kyoto Cabinet is a high performance database storage engine. The database is a simple data file organized in either a hash table or a B+ tree containing key value pairs which are variable length byte sequences.
The performance measurements have been made on an Intel Core i7-4700MQ 2.4GHz laptop with 16GB RAM, running Windows 10 64 bit.
Writing to the following was measured:
- A pair of 250GB SSDs in RAID0 (striped); and
- A 4GB RAM disk by
DATARAM

The RAM disk is useful for measuring the CPU load.
The time to write 1M, 10M or 100M records (i.e. key-value pairs) with sequentially increasing 64 bit keys has been measured. The size of the mapped value is either 4,8,16,32,..., or 8192 bytes. In the case of the 4GB RAM disk there is a limit imposed on the mapped value size to allow the database to fit on a 4GB drive. The data is written using 1000 transactions.
After writing the store it is closed then reopened, and all the records in the database are read with sequentially increasing keys.
It might be expected that the Kyoto HashDB will perform badly when the amount of data is too large to fit in the memory cache, if the sequential key access is randomised by the hash function.
Building the Kyoto library
Kyoto Cabinet version 1.2.76 was built using Microsoft Visual Studio 2015. The VCmakefile was modified to support an x64 build under VS2015 with dynamic CRT libs (i.e. using the /MD compiler switch instead of /MT):
VCPATH = C:\Program Files (x86)\Microsoft Visual Studio 14.0\VC
SDKPATH = C:\Program Files (x86)\Windows Kits\8.1
WINKITS_10 = C:\Program Files (x86)\Windows Kits\10
WINKITS_VER = 10.0.10240.0

CLFLAGS = /nologo \
  /I "$(VCPATH)\Include" /I "$(VCPATH)\PlatformSDK\Include" /I "$(SDKPATH)\Include" \
  /I "." \
  /DNDEBUG /D_CRT_SECURE_NO_WARNINGS \
  /O2 /EHsc /W3 /wd4244 /wd4351 /wd4800 /MD

LIBFLAGS = /nologo \
  /libpath:"$(VCPATH)\lib\amd64" /libpath:"$(WINKITS_10)\Lib\$(WINKITS_VER)\ucrt\x64" /libpath:"$(SDKPATH)\Lib\winv6.3\um\x64" \
  /libpath:"."
LINKFLAGS = /nologo \
  /libpath:"$(VCPATH)\lib\amd64" /libpath:"$(WINKITS_10)\Lib\$(WINKITS_VER)\ucrt\x64" /libpath:"$(SDKPATH)\Lib\winv6.3\um\x64" \
  /libpath:"."
Test code
HashDB database tuning
The following C++ code has been used to tune the HashDB for a given number of records. Earlier results without tuning suggest this is worth doing to achieve better performance.
void tuneDB(HashDB& db, int numRecords)
{
    db.tune_options(HashDB::TLINEAR);
    db.tune_buckets(2*numRecords);
    db.tune_map(512*1024*1024);
}
TreeDB database tuning
The following C++ code has been used to tune the TreeDB for a given number of records
void tuneDB(TreeDB& db, int numRecords)
{
    db.tune_options(TreeDB::TLINEAR);
    db.tune_buckets(numRecords / 10);
    db.tune_map(512*1024*1024);
}
Code to write key value pairs with sequential keys to a database
The following C++ code has been used to insert key,value pairs ("records") where the keys are sequentially increasing 64 bit numbers. This is achieved using a given number of transactions where each transaction inserts a given number of records. For simplicity the error handling code is not shown.
void write(const char* path, int numTxns, int numRecordsPerTxn, int mappedValueSize)
{
    HashDB db;
    int numRecords = numTxns * numRecordsPerTxn;
    tuneDB(db, numRecords);
    db.open(path, HashDB::OWRITER | HashDB::OCREATE);
    int64 id = 0;
    std::vector<char> buffer(mappedValueSize);
    for (int t=0 ; t < numTxns ; ++t)
    {
        db.begin_transaction();
        for (int r = 0; r < numRecordsPerTxn; ++r)
        {
            db.set( (const char*)&id, sizeof(id), buffer.data(), buffer.size());
            ++id;
        }
        db.end_transaction();
    }
    db.close();
}
Code to read key value pairs with sequential keys from a database
The following C++ code has been used to read all the records with sequentially increasing keys.
void read(const char* path, int numTxns, int numRecordsPerTxn, int mappedValueSize)
{
    HashDB db;
    int numRecords = numTxns * numRecordsPerTxn;
    tuneDB(db, numRecords);
    db.open(path, HashDB::OWRITER);
    std::vector<char> buffer(mappedValueSize);
    for (int64 id=0 ; id < numRecords ; ++id)
    {
        db.get((const char*)&id, sizeof(id), buffer.data(), buffer.size());
    }
    db.close();
}
Results
It would be good to do comparisons for the pair of SSDs in RAID0. Unfortunately it appears they have become heavily fragmented over time, such that the maximum write rate is only about 300-400MB/sec (it was about 850MB/sec originally).
The write and read rate is given both in terms of the records per second (the unit is kops/s which means 1000 records per second) and bytes per second (the unit is MB/s which means 220 bytes per second).
HashDB with RAM disk
| num txns | num records per txn | mapped value size (bytes) | total data (bytes) | database size (bytes) | space overhead per record (bytes) | write data time (s) | read data time (s) | write record rate (kops/s) | read record rate (kops/s) | effective write rate (MB/s) | effective read rate (MB/s) |
|---|---|---|---|---|---|---|---|---|---|---|---|
| 1,000 | 1,000 | 4 | 12,000,000 | 36,589,240 | 24.6 | 2.22 | 0.36 | 450 | 2,815 | 5.2 | 32.2 |
| 1,000 | 1,000 | 8 | 16,000,000 | 44,589,240 | 28.6 | 2.22 | 0.37 | 450 | 2,735 | 6.9 | 41.7 |
| 1,000 | 1,000 | 16 | 24,000,000 | 52,589,240 | 28.6 | 2.19 | 0.37 | 456 | 2,680 | 10.4 | 61.3 |
| 1,000 | 1,000 | 32 | 40,000,000 | 68,589,240 | 28.6 | 2.20 | 0.47 | 455 | 2,123 | 17.4 | 81.0 |
| 1,000 | 1,000 | 64 | 72,000,000 | 100,589,240 | 28.6 | 2.20 | 0.48 | 454 | 2,094 | 31.2 | 143.8 |
| 1,000 | 1,000 | 128 | 136,000,000 | 164,589,240 | 28.6 | 2.26 | 0.52 | 442 | 1,917 | 57.3 | 248.6 |
| 1,000 | 1,000 | 256 | 264,000,000 | 292,589,240 | 28.6 | 2.35 | 0.57 | 425 | 1,752 | 106.9 | 441.1 |
| 1,000 | 1,000 | 512 | 520,000,000 | 548,589,240 | 28.6 | 2.57 | 0.78 | 390 | 1,275 | 193.2 | 632.1 |
| 1,000 | 1,000 | 1,024 | 1,032,000,000 | 1,060,589,240 | 28.6 | 4.17 | 3.07 | 240 | 326 | 235.8 | 320.6 |
| 1,000 | 1,000 | 2,048 | 2,056,000,000 | 2,084,589,240 | 28.6 | 5.90 | 4.56 | 169 | 219 | 332.2 | 429.6 |
| 1,000 | 1,000 | 4,096 | 4,104,000,000 | 4,132,589,240 | 28.6 | 8.27 | 5.76 | 121 | 173 | 473.4 | 679.1 |
| 1,000 | 10,000 | 4 | 120,000,000 | 382,365,640 | 26.2 | 20.84 | 3.66 | 480 | 2,732 | 5.5 | 31.3 |
| 1,000 | 10,000 | 8 | 160,000,000 | 462,365,640 | 30.2 | 20.97 | 3.74 | 477 | 2,674 | 7.3 | 40.8 |
| 1,000 | 10,000 | 16 | 240,000,000 | 542,365,640 | 30.2 | 21.16 | 4.20 | 473 | 2,383 | 10.8 | 54.6 |
| 1,000 | 10,000 | 32 | 400,000,000 | 702,365,640 | 30.2 | 26.66 | 18.06 | 375 | 554 | 14.3 | 21.1 |
| 1,000 | 10,000 | 64 | 720,000,000 | 1,022,365,640 | 30.2 | 32.91 | 28.23 | 304 | 354 | 20.9 | 24.3 |
| 1,000 | 10,000 | 128 | 1,360,000,000 | 1,662,365,640 | 30.2 | 39.39 | 35.56 | 254 | 281 | 32.9 | 36.5 |
| 1,000 | 10,000 | 256 | 2,640,000,000 | 2,942,365,640 | 30.2 | 44.47 | 40.63 | 225 | 246 | 56.6 | 62.0 |
| 1,000 | 100,000 | 4 | 1,200,000,000 | 3,754,364,736 | 25.5 | 1,005.80 | 542.76 | 99 | 184 | 1.1 | 2.1 |
Note that the performance drops when the database size exceeds the cache (512MB). For example for 4 byte mapped values the write rate dropped from 5MB/s to about 1MB/s when writing 100M records.
TreeDB with RAM disk
| num txns | num records per txn | mapped value size (bytes) | total data (bytes) | database size (bytes) | space overhead per record (bytes) | write data time (s) | read data time (s) | write record rate (kops/s) | read record rate (kops/s) | effective write rate (MB/s) | effective read rate (MB/s) |
|---|---|---|---|---|---|---|---|---|---|---|---|
| 1,000 | 1,000 | 4 | 12,000,000 | 37,548,544 | 25.6 | 8.13 | 1.01 | 123 | 987 | 1.4 | 11.3 |
| 1,000 | 1,000 | 8 | 16,000,000 | 34,189,056 | 18.2 | 7.43 | 1.00 | 135 | 996 | 2.1 | 15.2 |
| 1,000 | 1,000 | 16 | 24,000,000 | 48,890,880 | 24.9 | 6.41 | 0.98 | 156 | 1,020 | 3.6 | 23.3 |
| 1,000 | 1,000 | 32 | 40,000,000 | 74,410,752 | 34.4 | 8.14 | 1.10 | 123 | 906 | 4.7 | 34.6 |
| 1,000 | 1,000 | 64 | 72,000,000 | 187,328,256 | 115.3 | 9.18 | 4.44 | 109 | 225 | 7.5 | 15.5 |
| 1,000 | 1,000 | 128 | 136,000,000 | 295,424,512 | 159.4 | 13.07 | 6.45 | 77 | 155 | 9.9 | 20.1 |
| 1,000 | 1,000 | 256 | 264,000,000 | 567,815,680 | 303.8 | 17.77 | 9.73 | 56 | 103 | 14.2 | 25.9 |
| 1,000 | 1,000 | 512 | 520,000,000 | 2,054,669,824 | 1,534.7 | 30.04 | 16.09 | 33 | 62 | 16.5 | 30.8 |
| 1,000 | 10,000 | 4 | 120,000,000 | 439,591,680 | 32.0 | 165.68 | 231.13 | 60 | 43 | 0.7 | 0.5 |
| 1,000 | 10,000 | 8 | 160,000,000 | 335,977,216 | 17.6 | 176.95 | 232.51 | 57 | 43 | 0.9 | 0.7 |
| 1,000 | 10,000 | 16 | 240,000,000 | 2,128,638,976 | 188.9 | 261.68 | 298.52 | 38 | 33 | 0.9 | 0.8 |
| 1,000 | 10,000 | 32 | 400,000,000 | 999,380,736 | 59.9 | 276.85 | 305.10 | 36 | 33 | 1.4 | 1.3 |
| 1,000 | 10,000 | 64 | 720,000,000 | 2,531,212,800 | 181.1 | 394.35 | 283.12 | 25 | 35 | 1.7 | 2.4 |
| 1,000 | 50,000 | 4 | 600,000,000 | 2,605,504,768 | 40.1 | 2,980.22 | 2,522.90 | 17 | 20 | 0.2 | 0.2 |
These measurements suggest the TreeDB doesn't perform well when the amount of data exceeds the memory cache.
CEDA LSS with RAM disk
| num txns | num records per txn | mapped value size (bytes) | total data (bytes) | database size (bytes) | space overhead per record (bytes) | write data time (s) | read data time (s) | write record rate (kops/s) | read record rate (kops/s) | effective write rate (MB/s) | effective read rate (MB/s) |
|---|---|---|---|---|---|---|---|---|---|---|---|
| 1,000 | 1,000 | 4 | 12,000,000 | 25,690,112 | 13.7 | 0.46 | 0.40 | 2,191 | 2,481 | 25.1 | 28.4 |
| 1,000 | 1,000 | 8 | 16,000,000 | 29,360,128 | 13.4 | 0.46 | 0.41 | 2,157 | 2,450 | 32.9 | 37.4 |
| 1,000 | 1,000 | 16 | 24,000,000 | 37,748,736 | 13.8 | 0.47 | 0.41 | 2,139 | 2,438 | 49.0 | 55.8 |
| 1,000 | 1,000 | 32 | 40,000,000 | 53,477,376 | 13.5 | 0.51 | 0.42 | 1,980 | 2,370 | 75.5 | 90.4 |
| 1,000 | 1,000 | 64 | 72,000,000 | 85,458,944 | 13.5 | 0.53 | 0.45 | 1,870 | 2,209 | 128.4 | 151.7 |
| 1,000 | 1,000 | 128 | 136,000,000 | 149,422,080 | 13.4 | 0.60 | 0.49 | 1,679 | 2,024 | 217.8 | 262.5 |
| 1,000 | 1,000 | 256 | 264,000,000 | 277,348,352 | 13.4 | 0.81 | 0.60 | 1,235 | 1,658 | 311.0 | 417.5 |
| 1,000 | 1,000 | 512 | 520,000,000 | 533,725,184 | 13.7 | 1.16 | 0.83 | 862 | 1,200 | 427.4 | 595.2 |
| 1,000 | 1,000 | 1,024 | 1,032,000,000 | 1,045,430,272 | 13.4 | 1.53 | 0.96 | 655 | 1,037 | 644.3 | 1,020.2 |
| 1,000 | 1,000 | 2,048 | 2,056,000,000 | 2,069,364,736 | 13.4 | 2.28 | 1.22 | 439 | 821 | 861.5 | 1,609.2 |
| 1,000 | 1,000 | 4,096 | 4,104,000,000 | 4,117,757,952 | 13.8 | 3.80 | 1.75 | 263 | 572 | 1,029.9 | 2,239.3 |
| 1,000 | 10,000 | 4 | 120,000,000 | 251,658,240 | 13.2 | 4.61 | 4.32 | 2,167 | 2,314 | 24.8 | 26.5 |
| 1,000 | 10,000 | 8 | 160,000,000 | 292,028,416 | 13.2 | 4.68 | 4.17 | 2,139 | 2,399 | 32.6 | 36.6 |
| 1,000 | 10,000 | 16 | 240,000,000 | 371,720,192 | 13.2 | 4.73 | 4.38 | 2,116 | 2,284 | 48.4 | 52.3 |
| 1,000 | 10,000 | 32 | 400,000,000 | 531,628,032 | 13.2 | 4.92 | 4.50 | 2,031 | 2,224 | 77.5 | 84.8 |
| 1,000 | 10,000 | 64 | 720,000,000 | 851,968,000 | 13.2 | 5.18 | 4.47 | 1,929 | 2,236 | 132.5 | 153.5 |
| 1,000 | 10,000 | 128 | 1,360,000,000 | 1,491,599,360 | 13.2 | 5.63 | 4.76 | 1,776 | 2,101 | 230.4 | 272.5 |
| 1,000 | 10,000 | 256 | 2,640,000,000 | 2,771,910,656 | 13.2 | 7.12 | 5.43 | 1,404 | 1,842 | 353.4 | 463.6 |
| 1,000 | 100,000 | 4 | 1,200,000,000 | 2,515,009,536 | 13.2 | 45.81 | 41.96 | 2,183 | 2,383 | 25.0 | 27.3 |
| 1,000 | 100,000 | 8 | 1,600,000,000 | 2,915,041,280 | 13.2 | 46.38 | 41.81 | 2,156 | 2,392 | 32.9 | 36.5 |
| 1,000 | 100,000 | 16 | 2,400,000,000 | 3,715,104,768 | 13.2 | 46.81 | 42.20 | 2,136 | 2,370 | 48.9 | 54.2 |
The CEDA LSS scales very well in this test, even though the database size well exceeds the size of the LSS segment cache. For 4, 8 and 16 byte mapped values the write and read rates are independent of the number of records from 1M to 100M records:
| num records | 4 byte value write rate (MB/s) | 4 byte value read rate (MB/s) | 8 byte value write rate (MB/s) | 8 byte value read rate (MB/s) | 16 byte value write rate (MB/s) | 16 byte value read rate (MB/s) |
|---|---|---|---|---|---|---|
| 1,000,000 | 25.1 | 28.4 | 32.9 | 37.4 | 49.0 | 55.8 |
| 10,000,000 | 24.8 | 26.5 | 32.6 | 36.6 | 48.4 | 52.3 |
| 100,000,000 | 25.0 | 27.3 | 32.9 | 36.5 | 48.9 | 54.2 |
CEDA B+Tree with RAM disk
| num txns | num records per txn | mapped value size (bytes) | total data (bytes) | database size (bytes) | space overhead per record (bytes) | write data time (s) | read data time (s) | write record rate (kops/s) | read record rate (kops/s) | effective write rate (MB/s) | effective read rate (MB/s) |
|---|---|---|---|---|---|---|---|---|---|---|---|
| 1,000 | 1,000 | 4 | 12,000,000 | 12,582,912 | 0.6 | 0.20 | 0.11 | 5,111 | 9,003 | 58.5 | 103.0 |
| 1,000 | 1,000 | 8 | 16,000,000 | 16,252,928 | 0.3 | 0.20 | 0.11 | 5,020 | 8,723 | 76.6 | 133.1 |
| 1,000 | 1,000 | 16 | 24,000,000 | 24,641,536 | 0.6 | 0.21 | 0.12 | 4,679 | 8,017 | 107.1 | 183.5 |
| 1,000 | 1,000 | 32 | 40,000,000 | 40,370,176 | 0.4 | 0.25 | 0.15 | 4,034 | 6,823 | 153.9 | 260.3 |
| 1,000 | 1,000 | 64 | 72,000,000 | 72,351,744 | 0.4 | 0.33 | 0.19 | 3,034 | 5,351 | 208.3 | 367.4 |
| 1,000 | 1,000 | 128 | 136,000,000 | 136,314,880 | 0.3 | 0.45 | 0.27 | 2,240 | 3,728 | 290.5 | 483.5 |
| 1,000 | 1,000 | 256 | 264,000,000 | 264,241,152 | 0.2 | 0.68 | 0.41 | 1,468 | 2,454 | 369.7 | 617.8 |
| 1,000 | 1,000 | 512 | 520,000,000 | 520,617,984 | 0.6 | 1.15 | 0.72 | 870 | 1,382 | 431.3 | 685.1 |
| 1,000 | 1,000 | 1,024 | 1,032,000,000 | 1,032,323,072 | 0.3 | 2.28 | 1.29 | 438 | 775 | 431.4 | 762.4 |
| 1,000 | 1,000 | 2,048 | 2,056,000,000 | 2,056,257,536 | 0.3 | 4.42 | 2.62 | 226 | 382 | 443.5 | 748.7 |
| 1,000 | 1,000 | 4,096 | 4,104,000,000 | 4,104,650,752 | 0.7 | 9.00 | 6.68 | 111 | 150 | 435.0 | 585.8 |
| 1,000 | 10,000 | 4 | 120,000,000 | 121,110,528 | 0.1 | 2.27 | 1.49 | 4,409 | 6,722 | 50.5 | 76.9 |
| 1,000 | 10,000 | 8 | 160,000,000 | 160,956,416 | 0.1 | 2.33 | 1.53 | 4,292 | 6,537 | 65.5 | 99.8 |
| 1,000 | 10,000 | 16 | 240,000,000 | 240,648,192 | 0.1 | 2.47 | 1.62 | 4,047 | 6,182 | 92.6 | 141.5 |
| 1,000 | 10,000 | 32 | 400,000,000 | 401,080,320 | 0.1 | 2.82 | 2.06 | 3,548 | 4,844 | 135.3 | 184.8 |
| 1,000 | 10,000 | 64 | 720,000,000 | 720,896,000 | 0.1 | 3.45 | 2.20 | 2,897 | 4,556 | 198.9 | 312.8 |
| 1,000 | 10,000 | 128 | 1,360,000,000 | 1,361,051,648 | 0.1 | 4.77 | 2.94 | 2,096 | 3,400 | 271.8 | 440.9 |
| 1,000 | 10,000 | 256 | 2,640,000,000 | 2,640,838,656 | 0.1 | 9.03 | 4.80 | 1,108 | 2,085 | 278.9 | 525.0 |
| 1,000 | 100,000 | 4 | 1,200,000,000 | 1,205,862,400 | 0.1 | 29.01 | 20.78 | 3,447 | 4,812 | 39.4 | 55.1 |
| 1,000 | 100,000 | 8 | 1,600,000,000 | 1,605,894,144 | 0.1 | 28.82 | 21.36 | 3,470 | 4,682 | 53.0 | 71.5 |
| 1,000 | 100,000 | 16 | 2,400,000,000 | 2,405,957,632 | 0.1 | 40.68 | 33.56 | 2,458 | 2,980 | 56.3 | 68.2 |
| 1,000 | 100,000 | 32 | 4,000,000,000 | 4,006,084,608 | 0.1 | 40.93 | 26.43 | 2,443 | 3,784 | 93.2 | 144.3 |
| 1,000 | 300,000 | 4 | 3,600,000,000 | 3,617,062,912 | 0.1 | 87.10 | 55.47 | 3,444 | 5,408 | 39.4 | 61.9 |
Side by side comparisons on RAM disk for 1M records
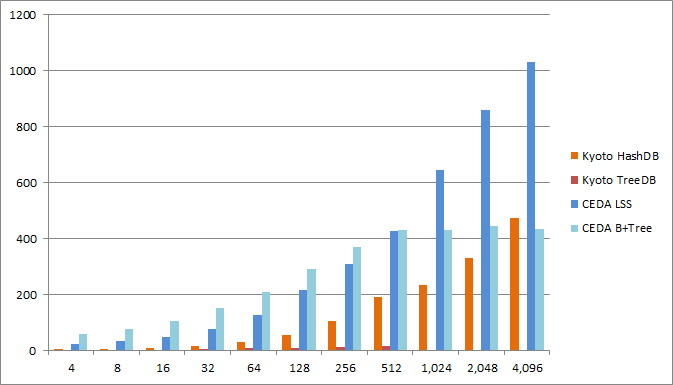
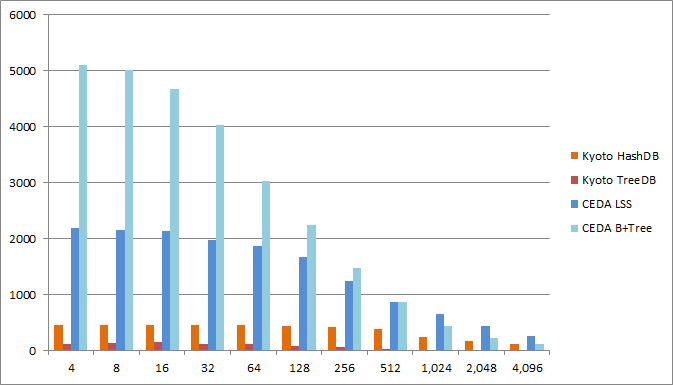
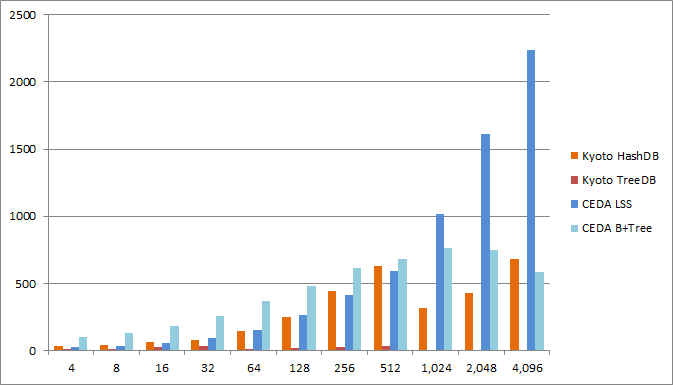
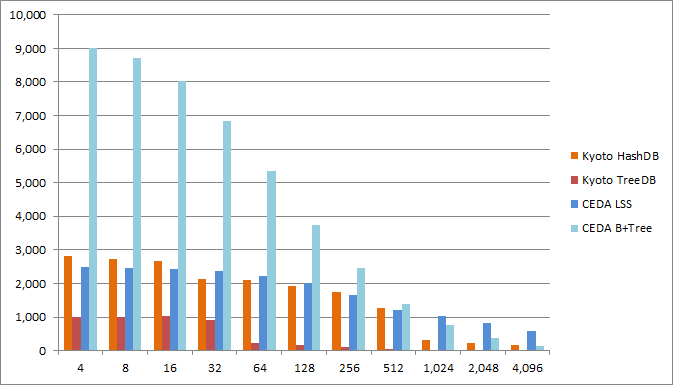
The following comparisons are between the CEDA LSS, CEDA B+Tree, Kyoto HashDB and Kyoto TreeDB on the same machine, built with the same compiler, for 1000 transactions and 1000000 records, on the 4GB RAM disk.
Note that there is no data for Kyoto TreeDB for mapped values of 1024, 2048 and 4096 bytes because in those cases the 4GB RAM disk wasn't large enough for the database.
Write octets rate
Comparison of the effective write rate in MB/second (i.e. the rate for which real data in the keys and values is written).
Write records rate
Comparison of the rate at which records are written in units of 1000 records/second.
Read octets rate
Comparison of the effective read rate in MB/second.
Read records rate
Comparison of the rate at which records are read in units of 1000 records/second.
Space overhead
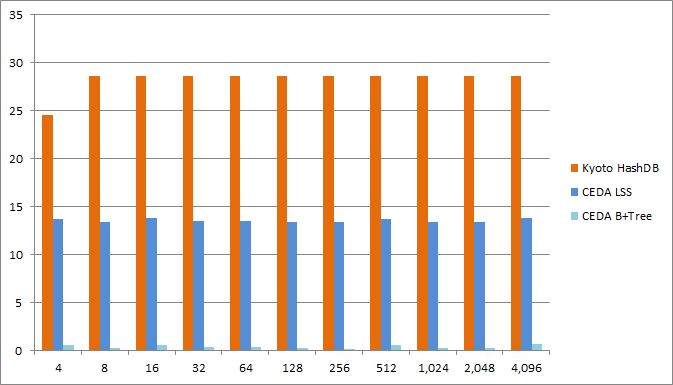
These plots show the average space overhead in bytes per key,value pair for different sizes of the mapped value.
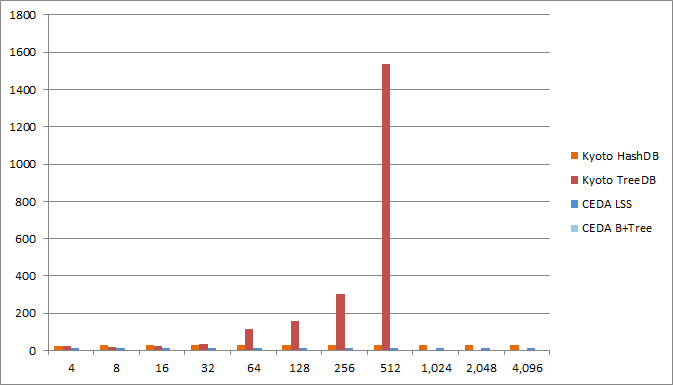
Taking out the Kyoto TreeDB allows us to see the space overheads of the other databases more clearly. The space overhead for the CEDA LSS is between 13 and 14 bytes, and less than one byte for the CEDA B+Tree.
